

Question: a. Caiculate two EBIT-EPS coordinates for each of the structures by selecting any two EBIT values and finding their a5sociated EPS values. b. Graph the
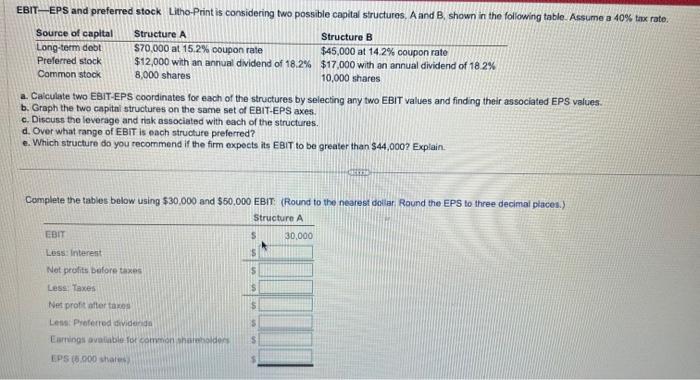
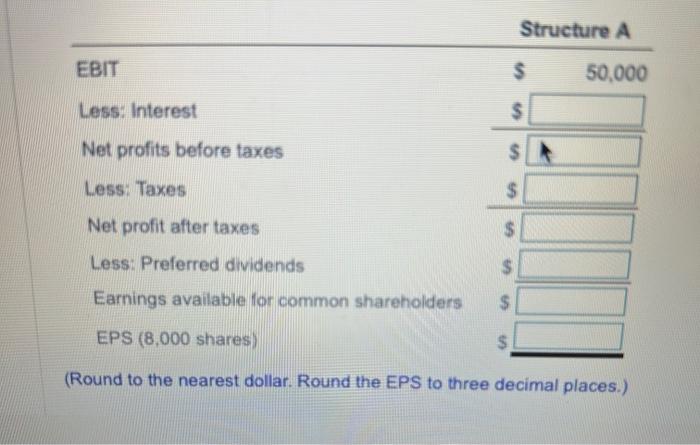
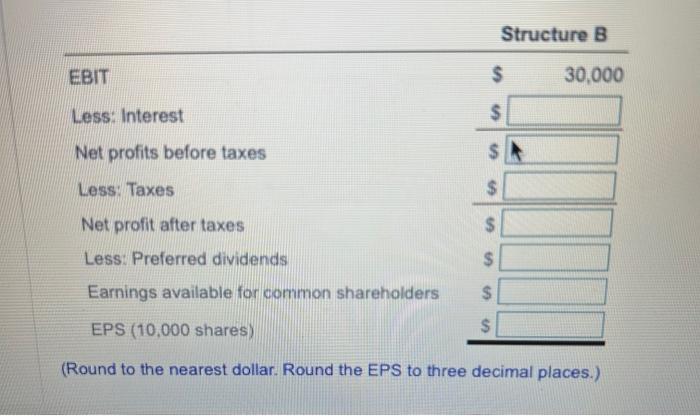
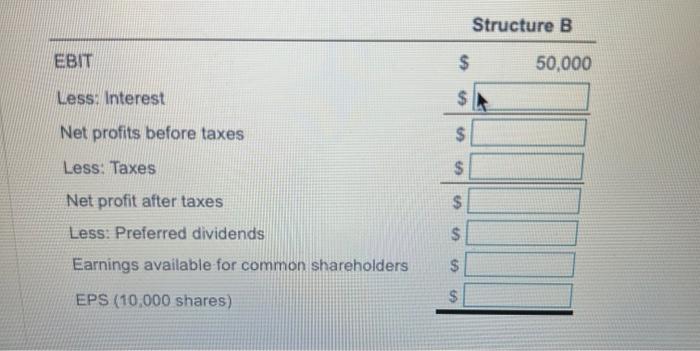
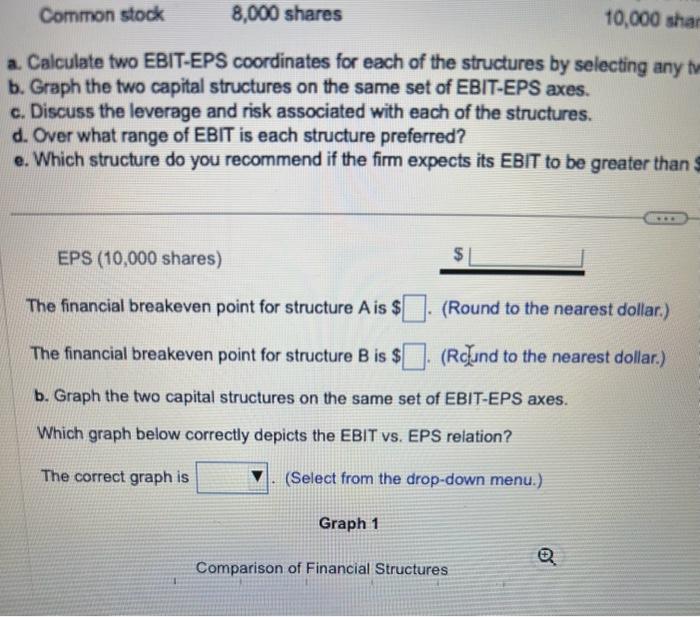
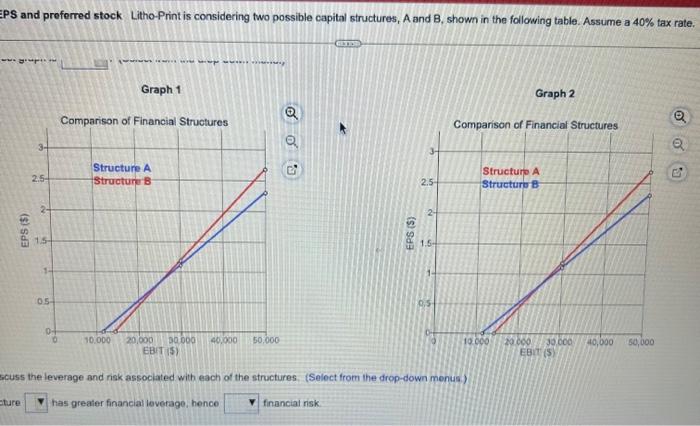
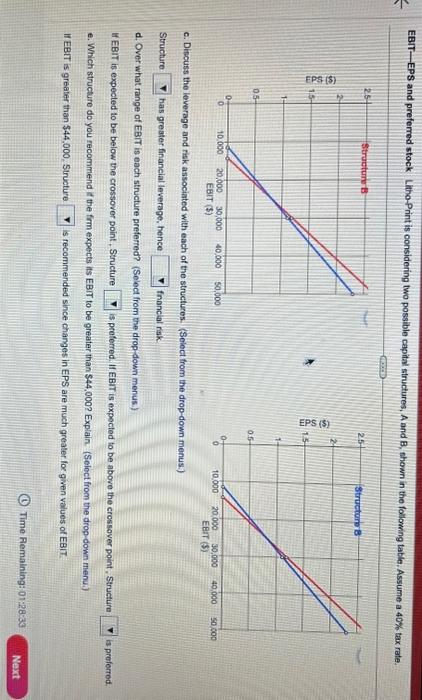
a. Caiculate two EBIT-EPS coordinates for each of the structures by selecting any two EBIT values and finding their a5sociated EPS values. b. Graph the two capithi structures on the same set of EBIT-EPS axes. c. Discuss the leverage and riak associated with each of the structures. d. Over what range of EBIT is each structure preferred? e. Which structure do you recommend if the firm expocts its EBIT to be greater than $44,000 ? Explain. Complete the tables below using $30,000 and $50,000 EBIT: (Round to the nearest dollar Round the EPS to three decimai places.) EBIT Less: Interest Net profits before taxes Less: Taxes Net profit after taxes Less: Preferred dividends Earnings availabie for common shareholders EPS (8,000 shares) (Round to the nearest dollar. Round the EPS to three decimal places.) (Round to the nearest dollar. Round the EPS to three decimal places.) EBIT Less: Interest Net profits before taxes Less: Taxes Net profit after taxes Less: Preferred dividends Earnings available for common shareholders EPS (10,000 shares) a. Calculate two EBIT-EPS coordinates for each of the structures by selecting any to b. Graph the two capital structures on the same set of EBIT-EPS axes. c. Discuss the leverage and risk associated with each of the structures. d. Over what range of EBIT is each structure preferred? e. Which structure do you recommend if the firm expects its EBIT to be greater than EPS (10,000 shares) $ The financial breakeven point for structure A is $. (Round to the nearest dollar.) The financial breakeven point for structure B is $ (Rnd to the nearest dollar.) b. Graph the two capital structures on the same set of EBIT-EPS axes. Which graph below correctly depicts the EBIT vs. EPS relation? The correct graph is (Select from the drop-down menu.) Graph 1 Comparison of Financial Structures . PS and preferred stock. Litho-Print is considering two possible capital structures, A and B, shown in the following table. Assume a 40% tax rate. Granh 1 Graph 2 scuss the leverage and risk associated with each of the structures. (Select from the drop-down menus) cture has greaier financial leverage, hence financiat risk EBT-EPS and preferred stock Litho-Print is considering two possible capital structures, A and B, thown in the following table. Assume a 4CF tax rate. c. Difcuss the leverage and risk associated with each of the structures. (Select from the drop-down menus.) Structure has greater financial leverage, hence fingncal risk. d. Over what range of EBIT is each structure preferred? (Select from the drop-down menus.) If EBIT is expected to be below the crossover point, Structure is preferred. If EBIT is expected to be above the crossover point, Structure e. Which structure do you recommend it the fim expects its EBIT to be greater than $44,000 ? Explain. (Seioct from the drog-down menu.) If EBIT is greater than $44,000. Structure Is recommended since changes in EPS are much greater foe given values of EBIT
Step by Step Solution
There are 3 Steps involved in it

Get step-by-step solutions from verified subject matter experts