

Question: a) Calculate the control limits and center line based on the following data. b) Draw the control charts and show the samples on the
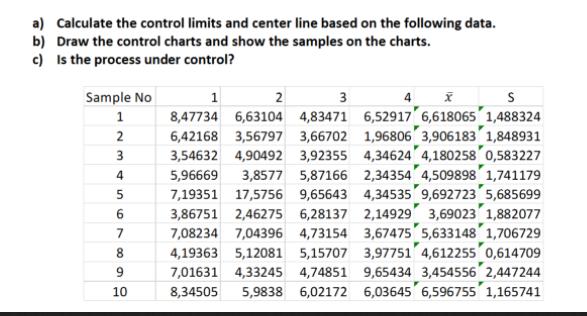
a) Calculate the control limits and center line based on the following data. b) Draw the control charts and show the samples on the charts. c) Is the process under control? Sample No 1 2 3 4 5 6 7 8 9 10 1 2 3 S 4 x 8,47734 6,63104 4,83471 6,52917 6,618065 1,488324 6,42168 3,56797 3,66702 1,96806 3,906183 1,848931 3,54632 4,90492 3,92355 4,34624 4,180258 0,583227 5,96669 3,8577 5,87166 2,34354 4,509898 1,741179 7,19351 17,5756 9,65643 4,34535 9,692723 5,685699 3,86751 2,46275 6,28137 2,14929 3,69023 1,882077 7,08234 7,04396 4,73154 3,67475 5,633148 1,706729 4,19363 5,12081 5,15707 3,97751 4,612255 0,614709 7,01631 4,33245 4,74851 9,65434 3,454556 2,447244 6,02172 6,03645 6,596755 1,165741 8,34505 5,9838
Step by Step Solution
There are 3 Steps involved in it
The image youve provided appears to display a table of sample data likely from a process or study with corresponding barX values sample means and S va... View full answer

Get step-by-step solutions from verified subject matter experts