

Question: a. Calculate the test statistic. b. Determine the P-value for this f-test. c. Draw a conclusion. Use =0.05. _____ H0. This result indicates that there
a. Calculate the test statistic.
b. Determine the P-value for this f-test.
c. Draw a conclusion. Use α=0.05.
_____ H0. This result indicates that there is _____ evidence to conclude that the variance of times for men is higher than the variance of times for women.
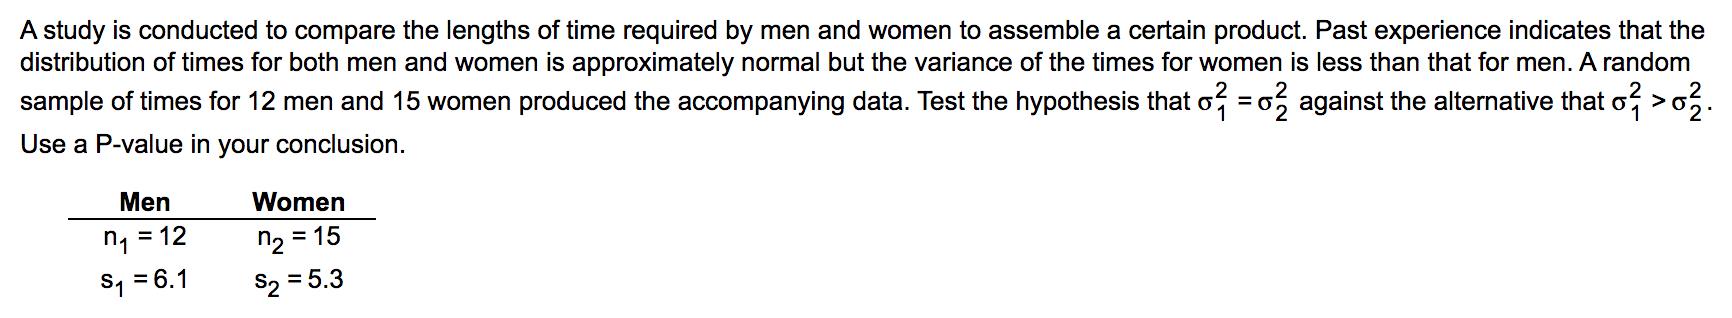
A study is conducted to compare the lengths of time required by men and women to assemble a certain product. Past experience indicates that the distribution of times for both men and women is approximately normal but the variance of the times for women is less than that for men. A random sample of times for 12 men and 15 women produced the accompanying data. Test the hypothesis that o = 02 against the alternative that o? >0} 2. Use a P-value in your conclusion. Men n =12 S =6.1 Women n2=15 $25.3
Step by Step Solution
There are 3 Steps involved in it
The image you sent is a statistical hypothesis testing problem The null hypothesis is that the population variances for the time to assemble a certain product by men and women are equal1222 The altern... View full answer

Get step-by-step solutions from verified subject matter experts