Question: A car company is interpreting the field data. Note that each individual car has a ca ID, e.g. car01, car02, etc. Note that each individual
A car company is interpreting the field data.
Note that each individual car has a ca ID, e.g. car01, car02, etc. Note that each individual tire has an individual SN (SN is the abbreviation from serial number), e.g. T01, T02, etc. Note that each computer installed has an individual serial number, e.g. C01, C02, etc.
Any computer failure induces a down-time: failure investigating, computer removal, supplier failure investigation, failure fix, re-certification, shipment, re-installation. It is considered that, after failure, a computer is fixed and reinstalled on the same car. Each computer failure induced a down-time, measured in hours, given in the table below. Any tire failure induces an average down-time of 2h. In this context, the down-time (computer or tire induced) should be understood as lost operating time (car could have been operated for the down-time). A computer failure costs 2,500$ and a tire replacement is 350$. The company has a contractual cost target of 0.03$/km and car MTBF (all failures) target of 30.000km.
Data is presented in the Assignment MTTF MTBF Availability Cost - data input.xlsx file. Data is provided per year quarter. Notation 2017Q1 stands for first quarter, first 3 months of 2017 (January, February, March). # stands for number of, e.g. # of tire failures means number of tire failures.
Requirements (see all pages!):
Compute and interpret the results.
for computer:
1. MTTF (to first failure) computed in km
2. MTBF (after the first failure) computed in km
3. MTBF (all failures included) computed in km
4. 12 month moving average (all failures) at the end of the quarter
Note: A regular 12-month average reduces a year of monthly figures into a single average number. A 12-month rolling average, or moving average, is simply a series of 12-month averages over multiple consecutive 12-month periods. This statistical tool can help you gauge the overall direction of a series of monthly data, because it smooths out the effects of month-to-month changes. You can use a 12-month rolling average to analyze almost any type of monthly numbers, such as revenues, profits, stock prices or account balances.
5. Availability (all failures included)
for tires:
6. MTTF
7. 12m moving average at the end of the quarter
8. Availability
for car:
9. MTBF (in km and in h)
10. 12-month MTBF (in km) moving average (MTBF includes all failures) at the end of the quarter
11. 12-month moving average cost per km at the end of the quarter
12. average cost per km
13. average cost per h
14. Availability (all failures included)
Present the results in the following format:
- Results summary
| 1 | MTTF computer km | |
| 2 | MTBF computer from 2nd failure) km | |
| 3 | MTBF computer (first failure included) km | |
| 4 | 12m moving average MTBF computer km | see table 1 |
| 5 | computer availability | __________% |
| 6 | tire MTTF km | |
| 7 | 12month tire MTTF moving average | see table 2 |
| 8 | tire availability | __________% |
| 9 | car MTBF in km | |
| 10 | car 12m moving avg | see table 3 |
| 11 | 12month moving average cost /km | see table 4 |
| 12 | Average car cost per km | |
| 13 | Average car cost per h | |
| 14 | Car availability | __________% |
- Moving average results table
| | 12 computer MTBF (in km) | 12m tire MTTF (in km) | 12m car MTTF (in km) | cost per km |
| 2012 Q4 | | | | |
| 2013 Q1 | | | | |
| 2013 Q2 | | | | |
| 2013 Q3 | | | | |
| 2013 Q4 | | | | |
| 2014 Q1 | | | | |
| 2014 Q2 | | | | |
| 2014 Q3 | | | | |
| 2014 Q4 | | | | |
| 2015 Q1 | | | | |
| 2015 Q2 | | | | |
| 2015 Q3 | | | | |
| 2015 Q4 | | | | |
| 2016 Q1 | | | | |
| 2016 Q2 | | | | |
| 2016 Q3 | | | | |
| 2016 Q4 | | | | |
| 2017 Q1 | | | | |
| 2017 Q2 | | | | |
| 2017 Q3 | | | | |
| 2017 Q4 | | | | |
Data:
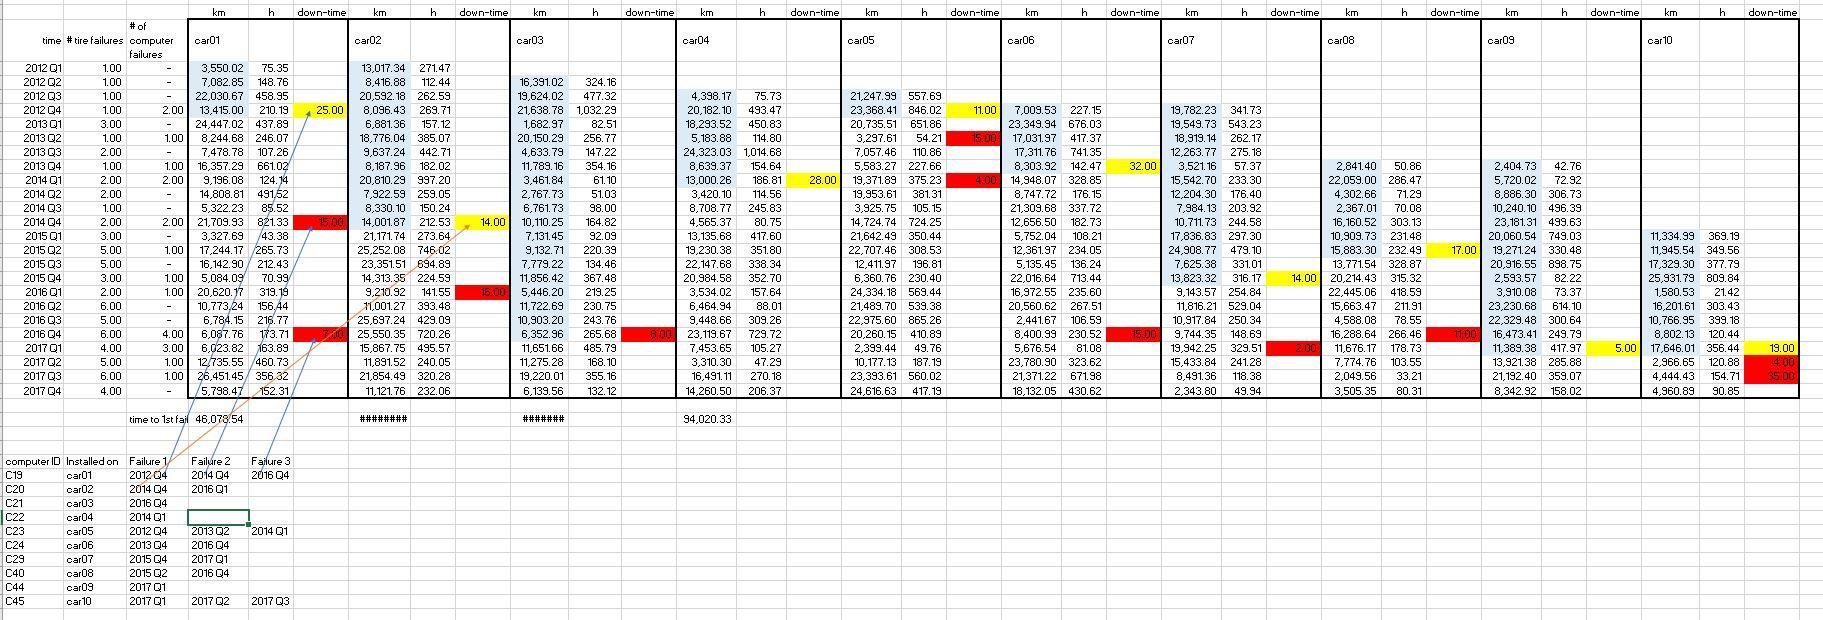
down-time km h down-time km h down-time km h down-time km h down-time km h down-time km h down-time km h down-time km h down-time km h down-time car02 car03 car04 car05 car06 car07 car08 car09 car 10 25.00 32.00 km h # of time #tire failures computer car01 failures 2012 Q1 1.00 3,550.02 75.35 2012 Q2 1.00 7,082.85 148.76 2012 Q3 1.00 22,030.67 458.95 2012 Q4 1.00 2.00 13,415.00 210.19 2013 01 3.00 24,447.02 437.89 2013 Q2 1.00 1.00 8,244.68 246.07 2013 Q3 2.00 7,478.78 107.26 2013 Q4 1.00 1.00 16,357.29 661.02 2014 01 2.00 2.00 9.196.08 124.14 2014 Q2 2.00 14,808.81 491,52 2014 Q3 1.00 5,322.23 85.52 2014 Q4 2.00 2.00 21.709.93 821.33 2015 Q1 3.00 3,327.69 43.38 2015 Q2 5.00 1.00 17,244.17 265.73 2015 Q3 5.00 16.142.90 212.43 2015 04 3.00 1.00 5,084,09 70.99 2016 Q1 2.00 1.00 20,620.17 319.15 2016 Q2 6.00 - 10,773,24 156,44 2016 Q3 5.00 6,784.15 216.77 2016 04 6.00 4.00 6,087.76 173.71 2017 01 4.00 3.00 6,023.82 163.89 2017 Q2 5.00 1.00 12,735.55 460.73 2017 Q3 6.00 1.00 26,451.45 356 32 2017 Q4 4.00 5,798.47 152.31 15.00 13,017.34 271.47 8,416.88 112.44 20,592.18 262.59 8,096.43 269.71 6,881.36 157.12 18,776.04 385.07 9,637.24 442.71 8,187.96 182.02 20,810.29 997.20 7,922.59 259.05 8,330.10 150.24 14, 00187 212.53 21,171.74 273.64 25,252.08 746.02 23,351.51 694.89 14,313.35 224.59 9,210.92 141.55 11,001.27 393.48 25,697.24 429.09 25,550.35 720.26 15,867.75 495.57 11,891.52 240.05 21,854.49 320.28 11,121.76 232.06 16,391.02 324.16 19,624.02 477.32 21,638,78 1,032.29 1.682.97 82.51 20.150.29 256.77 4,633.79 147.22 11,789.16 354.16 3,461.84 61.10 2,767.73 5103 6,761.73 98.00 14.00 10.110.25 164.82 7,131.45 92.09 9,132.71 220.39 7,779.22 134.46 11,856.42 367.48 16.00 5,446,20 219.25 11,722.69 230.75 10,903.20 243.76 6,352.96 265.68 11,651.66 485.79 11,275.28 168.10 19,220.01 355.16 6,139.56 132.12 4,398.17 75.73 20,182.10 493.47 18,293.52 450.83 5,183.88 114.80 24,323,03 1,014.68 8,639.37 154.64 13,000.26 186.81 3,420.10 114.56 8,708.77 245.83 4.565.37 80.75 13,135.68 417.60 19,230.38 351.80 22.147.68 338.34 20.984.58 352.70 3,534.02 157.64 6.464.94 88.01 9,448.66 309.26 23,119,67 729.72 7,453.65 105.27 3,310.30 47.29 16,491.11 270.18 14,260.50 206.37 21,247.99 557.69 23,368.41 846.02 20,735.51 651.86 3,297.61 54.21 7,057.46 110.86 5,583.27 227.66 28.00 19,371.89 375.23 19,953.61 381.31 3,925.75 105.15 14,724.74 724.25 21,642.49 350.44 22,707.46 308.53 12,411.97 196.81 6,360.76 230.40 24,334.18 569.44 21,489.70 539.38 22,975.60 865.26 20,260.15 410.89 2,399.44 49.76 10.177.13 187.19 23,393.61 560.02 24,616.63 417.19 11.00 7,009.53 227.15 23,349.94 676.03 15.00 17,031.97 417.37 17,311.76 741.35 8,303.92 142.47 4:00 14,948.07 328.85 8,747.72 176.15 21,309.68 337.72 12,656.50 182.73 5,752.04 108.21 12,361.97 234.05 5,135.45 136.24 22,016.64 713.44 16,972.55 235.60 20,560.62 267.51 2,441.67 106.59 8,400.99 230.52 5,676.54 81.08 23,780.90 323.62 21,371.22 671.98 18.132.05 430,62 19,782.23 341.73 19,549.73 543.23 18,919.14 262.17 12,263.77 275.18 3,521.16 57.37 15,542.70 233,30 12,204.30 176.40 7,984.13 203.92 10,711.73 244.58 17,836.83 297.30 24,908.77 479.10 7,625.38 331.01 13,823.32 316.17 9,143.57 254.84 11,816.21 529.04 10,917.84 250.34 9,744.35 148.69 19,942.25 329.51 15,433.84 241.28 8,49136 118.38 2,343.80 49.94 2,841.40 50.86 22,059.00 286.47 4,302.66 71.29 2.367.01 70.08 16,160.52 303.13 10.909.73 231.48 15,883.30 232.49 13,771.54 328.87 14.00 20.214.43 315.32 22,445.06 418.59 15,663.47 211.91 4,588.08 78.55 16,288.64 266.46 2.00 11,676.17 178.73 7.774.76 103,55 2,049.56 33.21 3,505.35 80.31 2,404.73 42.76 5,720.02 72.92 8,886.30 306.73 10,240.10 496.39 23, 181.31 499.63 20,060.54 749.03 17.00 19.271.24 330,48 20,916.55 898.75 2,593,57 82.22 3,910.08 73.37 23,230.68 614.10 22,329.48 300,64 16,473.41 249.79 11,389.38 417.97 13,921.38 285.88 21,192.40 359.07 8,342.92 158.02 11,334.99 369.19 11,945.54 349.56 17,329.30 377.79 25,931.79 809.84 1,580.53 21.42 16,201.61 303.43 10,766.95 399.18 8,802.13 120.44 5.00 17,646.01 356.44 2,966.65 120.88 4,444.43 154.71 4,960.89 90.85 15.00 100 19.00 4.00 35.00 time to 1st fail 46,078.54 ######## ####### 94,020.33 Failure 2 2014 Q4 2016 Q1 Failure 3 2016 Q4 computer ID Installed on Failure 1 C19 car01 2012 Q4 C20 car02 2014 Q4 C21 car03 2016 Q4 C22 car04 2014 Q1 C23 car05 2012 Q4 C24 car06 2013 Q4 C29 Car07 2015 Q4 C40 car08 2015 Q2 C44 Car09 2017 01 C45 car 10 2017 Q1 2014 Q1 2013 Q2 2016 04 2017 Q1 2016 Q4 2017 Q2 2017 Q3 down-time km h down-time km h down-time km h down-time km h down-time km h down-time km h down-time km h down-time km h down-time km h down-time car02 car03 car04 car05 car06 car07 car08 car09 car 10 25.00 32.00 km h # of time #tire failures computer car01 failures 2012 Q1 1.00 3,550.02 75.35 2012 Q2 1.00 7,082.85 148.76 2012 Q3 1.00 22,030.67 458.95 2012 Q4 1.00 2.00 13,415.00 210.19 2013 01 3.00 24,447.02 437.89 2013 Q2 1.00 1.00 8,244.68 246.07 2013 Q3 2.00 7,478.78 107.26 2013 Q4 1.00 1.00 16,357.29 661.02 2014 01 2.00 2.00 9.196.08 124.14 2014 Q2 2.00 14,808.81 491,52 2014 Q3 1.00 5,322.23 85.52 2014 Q4 2.00 2.00 21.709.93 821.33 2015 Q1 3.00 3,327.69 43.38 2015 Q2 5.00 1.00 17,244.17 265.73 2015 Q3 5.00 16.142.90 212.43 2015 04 3.00 1.00 5,084,09 70.99 2016 Q1 2.00 1.00 20,620.17 319.15 2016 Q2 6.00 - 10,773,24 156,44 2016 Q3 5.00 6,784.15 216.77 2016 04 6.00 4.00 6,087.76 173.71 2017 01 4.00 3.00 6,023.82 163.89 2017 Q2 5.00 1.00 12,735.55 460.73 2017 Q3 6.00 1.00 26,451.45 356 32 2017 Q4 4.00 5,798.47 152.31 15.00 13,017.34 271.47 8,416.88 112.44 20,592.18 262.59 8,096.43 269.71 6,881.36 157.12 18,776.04 385.07 9,637.24 442.71 8,187.96 182.02 20,810.29 997.20 7,922.59 259.05 8,330.10 150.24 14, 00187 212.53 21,171.74 273.64 25,252.08 746.02 23,351.51 694.89 14,313.35 224.59 9,210.92 141.55 11,001.27 393.48 25,697.24 429.09 25,550.35 720.26 15,867.75 495.57 11,891.52 240.05 21,854.49 320.28 11,121.76 232.06 16,391.02 324.16 19,624.02 477.32 21,638,78 1,032.29 1.682.97 82.51 20.150.29 256.77 4,633.79 147.22 11,789.16 354.16 3,461.84 61.10 2,767.73 5103 6,761.73 98.00 14.00 10.110.25 164.82 7,131.45 92.09 9,132.71 220.39 7,779.22 134.46 11,856.42 367.48 16.00 5,446,20 219.25 11,722.69 230.75 10,903.20 243.76 6,352.96 265.68 11,651.66 485.79 11,275.28 168.10 19,220.01 355.16 6,139.56 132.12 4,398.17 75.73 20,182.10 493.47 18,293.52 450.83 5,183.88 114.80 24,323,03 1,014.68 8,639.37 154.64 13,000.26 186.81 3,420.10 114.56 8,708.77 245.83 4.565.37 80.75 13,135.68 417.60 19,230.38 351.80 22.147.68 338.34 20.984.58 352.70 3,534.02 157.64 6.464.94 88.01 9,448.66 309.26 23,119,67 729.72 7,453.65 105.27 3,310.30 47.29 16,491.11 270.18 14,260.50 206.37 21,247.99 557.69 23,368.41 846.02 20,735.51 651.86 3,297.61 54.21 7,057.46 110.86 5,583.27 227.66 28.00 19,371.89 375.23 19,953.61 381.31 3,925.75 105.15 14,724.74 724.25 21,642.49 350.44 22,707.46 308.53 12,411.97 196.81 6,360.76 230.40 24,334.18 569.44 21,489.70 539.38 22,975.60 865.26 20,260.15 410.89 2,399.44 49.76 10.177.13 187.19 23,393.61 560.02 24,616.63 417.19 11.00 7,009.53 227.15 23,349.94 676.03 15.00 17,031.97 417.37 17,311.76 741.35 8,303.92 142.47 4:00 14,948.07 328.85 8,747.72 176.15 21,309.68 337.72 12,656.50 182.73 5,752.04 108.21 12,361.97 234.05 5,135.45 136.24 22,016.64 713.44 16,972.55 235.60 20,560.62 267.51 2,441.67 106.59 8,400.99 230.52 5,676.54 81.08 23,780.90 323.62 21,371.22 671.98 18.132.05 430,62 19,782.23 341.73 19,549.73 543.23 18,919.14 262.17 12,263.77 275.18 3,521.16 57.37 15,542.70 233,30 12,204.30 176.40 7,984.13 203.92 10,711.73 244.58 17,836.83 297.30 24,908.77 479.10 7,625.38 331.01 13,823.32 316.17 9,143.57 254.84 11,816.21 529.04 10,917.84 250.34 9,744.35 148.69 19,942.25 329.51 15,433.84 241.28 8,49136 118.38 2,343.80 49.94 2,841.40 50.86 22,059.00 286.47 4,302.66 71.29 2.367.01 70.08 16,160.52 303.13 10.909.73 231.48 15,883.30 232.49 13,771.54 328.87 14.00 20.214.43 315.32 22,445.06 418.59 15,663.47 211.91 4,588.08 78.55 16,288.64 266.46 2.00 11,676.17 178.73 7.774.76 103,55 2,049.56 33.21 3,505.35 80.31 2,404.73 42.76 5,720.02 72.92 8,886.30 306.73 10,240.10 496.39 23, 181.31 499.63 20,060.54 749.03 17.00 19.271.24 330,48 20,916.55 898.75 2,593,57 82.22 3,910.08 73.37 23,230.68 614.10 22,329.48 300,64 16,473.41 249.79 11,389.38 417.97 13,921.38 285.88 21,192.40 359.07 8,342.92 158.02 11,334.99 369.19 11,945.54 349.56 17,329.30 377.79 25,931.79 809.84 1,580.53 21.42 16,201.61 303.43 10,766.95 399.18 8,802.13 120.44 5.00 17,646.01 356.44 2,966.65 120.88 4,444.43 154.71 4,960.89 90.85 15.00 100 19.00 4.00 35.00 time to 1st fail 46,078.54 ######## ####### 94,020.33 Failure 2 2014 Q4 2016 Q1 Failure 3 2016 Q4 computer ID Installed on Failure 1 C19 car01 2012 Q4 C20 car02 2014 Q4 C21 car03 2016 Q4 C22 car04 2014 Q1 C23 car05 2012 Q4 C24 car06 2013 Q4 C29 Car07 2015 Q4 C40 car08 2015 Q2 C44 Car09 2017 01 C45 car 10 2017 Q1 2014 Q1 2013 Q2 2016 04 2017 Q1 2016 Q4 2017 Q2 2017 Q3


