

Question: a. Compute the average return for each of the assets from 1929 to 1940 (the Great Depression). b. Compute the variance and standard deviation for
a. Compute the average return for each of the assets from 1929 to 1940 (the Great Depression).
b. Compute the variance and standard deviation for each of the assets from 1929 to 1940.
c. Which asset was riskiest during the Great Depression? How does that fit with your intuition?
Note:
Notice that the answers for average return, variance and standard deviation must be entered in decimal format.
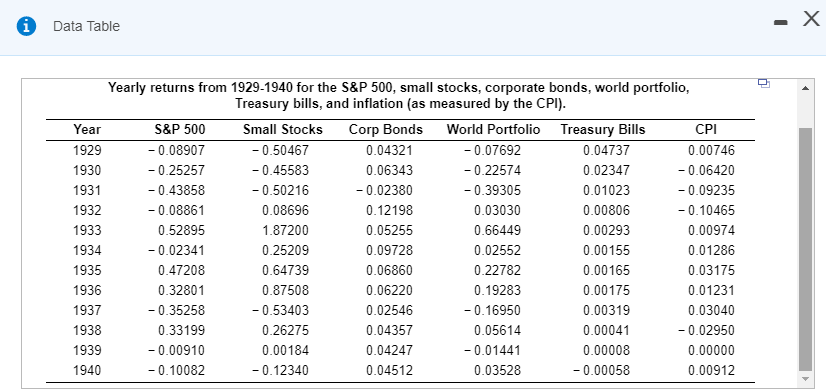
- X i Data Table Yearly returns from 1929-1940 for the S&P 500, small stocks, corporate bonds, world portfolio, Treasury bills, and inflation (as measured by the CPI) Year S&P 500 Small Stocks Corp Bonds World Portfolio Treasury Bills CPI 1929 0.08907 -0.50467 0.04321 -0.07692 0.04737 0.00746 - 0.25257 1930 -0.45583 0.06343 -0.22574 0.02347 -0.06420 -0.50216 -0.02380 1931 -0.43858 -0.39305 0.01023 -0.09235 1932 0.03030 0.00806 -0.08861 0.08696 0.12198 0.10465 1933 0.52895 1.87200 0.05255 0.66449 0.00293 0.00974 -0.02341 0.02552 1934 0.25209 0.09728 0.00155 0.01286 0.06860 0.22782 0.00165 0.03175 1935 0.47208 0.64739 0.06220 0.19283 1936 0.32801 0.87508 0.00175 0.01231 0.00319 1937 -0.35258 -0.53403 0.02546 -0.16950 0.03040 0.04357 0.02950 1938 0.33199 0.26275 0.05614 0.00041 . 0.00184 0.00008 1939 -0.00910 0.04247 -0.01441 0.00000 -0.10082 -0.00058 0.00912 1940 0.12340 0.04512 0.03528 - X i Data Table Yearly returns from 1929-1940 for the S&P 500, small stocks, corporate bonds, world portfolio, Treasury bills, and inflation (as measured by the CPI) Year S&P 500 Small Stocks Corp Bonds World Portfolio Treasury Bills CPI 1929 0.08907 -0.50467 0.04321 -0.07692 0.04737 0.00746 - 0.25257 1930 -0.45583 0.06343 -0.22574 0.02347 -0.06420 -0.50216 -0.02380 1931 -0.43858 -0.39305 0.01023 -0.09235 1932 0.03030 0.00806 -0.08861 0.08696 0.12198 0.10465 1933 0.52895 1.87200 0.05255 0.66449 0.00293 0.00974 -0.02341 0.02552 1934 0.25209 0.09728 0.00155 0.01286 0.06860 0.22782 0.00165 0.03175 1935 0.47208 0.64739 0.06220 0.19283 1936 0.32801 0.87508 0.00175 0.01231 0.00319 1937 -0.35258 -0.53403 0.02546 -0.16950 0.03040 0.04357 0.02950 1938 0.33199 0.26275 0.05614 0.00041 . 0.00184 0.00008 1939 -0.00910 0.04247 -0.01441 0.00000 -0.10082 -0.00058 0.00912 1940 0.12340 0.04512 0.03528
Step by Step Solution
There are 3 Steps involved in it

Get step-by-step solutions from verified subject matter experts