

Question: a. Compute the sample mean and sample range (shown as a question mark in the table) for day 1. b. Compute the grand mean and
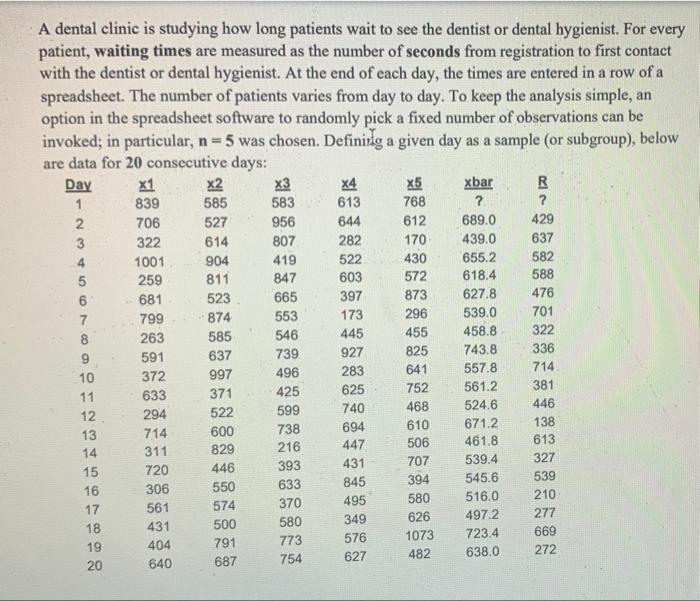
a. Compute the sample mean and sample range (shown as a question mark in the table) for day 1.
b. Compute the grand mean and the average range . c. Calculate the and control chart limits for these data. Is the process in statistical control? NOTE: You do not need to plot the control charts, just check whether the statistics plotted on these charts fall within the control limits and then conclude whether the process is in control or not.
d. Estimate the (unknown) true mean and standard deviation of the process generating the individual (waiting time) measurements.
e. Experience suggests that people generally become dissatisfied when having to wait more than 15 minutes. Based on your estimates in part b, estimate the probability that a patient will have to wait 15 minutes or more (i.e. estimate the fraction (or proportion) of patients that will wait 15 minutes or more). Assume that the waiting time variable can be well approximated by the normal distribution. (Hint: use the normal curve areas to compute this quantity)
f. Suppose that USL = 15 minutes and LSL = 0 minutes, what conclusions would you draw about process capability of this dental clinic? That is, calculate/estimate the potential capability of the process p and the actual process capabilities. pu, pt pk. Comment on the results
Step by Step Solution
There are 3 Steps involved in it
1 Expert Approved Answer
Step: 1 Unlock

Question Has Been Solved by an Expert!
Get step-by-step solutions from verified subject matter experts
Step: 2 Unlock
Step: 3 Unlock