

Question: a. Conditional formatting and data sort begin{tabular}{lcc} Control & % Time Reduction & % Reduction Loss hline Anti-fraud policy & 50% & 47%
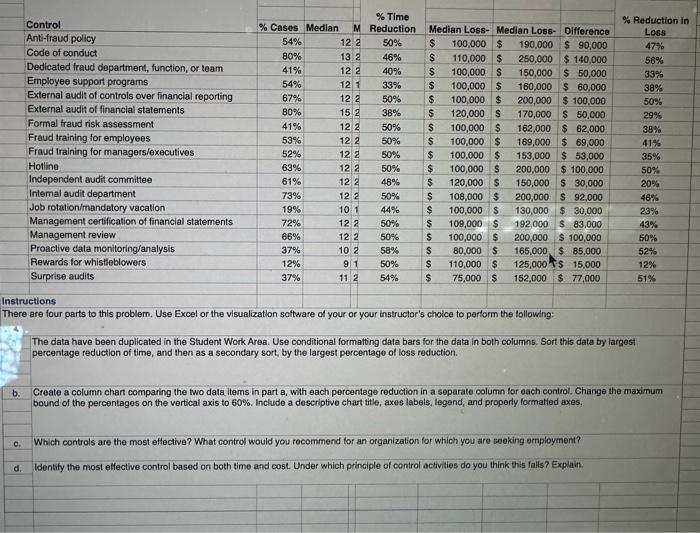
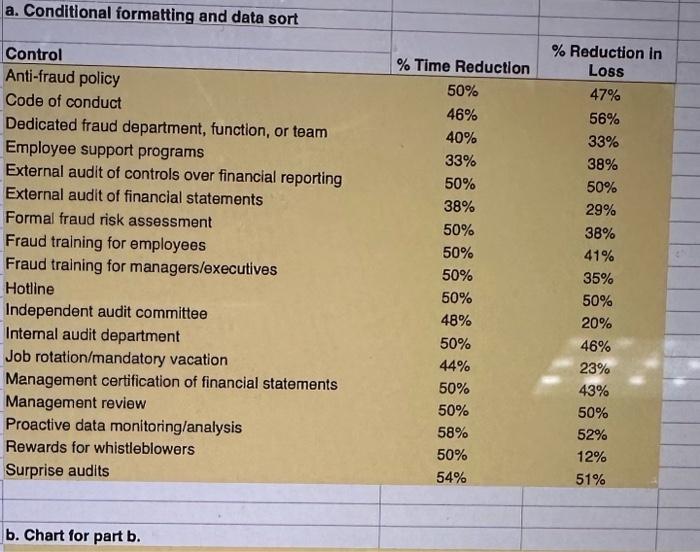
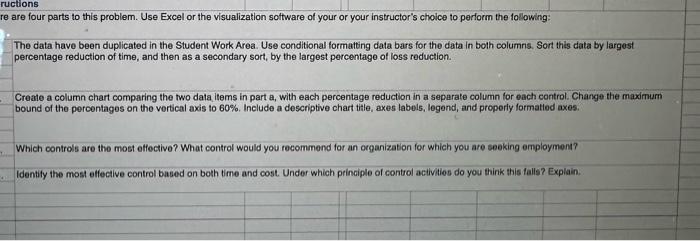
a. Conditional formatting and data sort \begin{tabular}{lcc} Control & \% Time Reduction & \% Reduction Loss \\ \hline Anti-fraud policy & 50% & 47% \\ Code of conduct & 46% & 56% \\ Dedicated fraud department, function, or team & 40% & 33% \\ Employee support programs & 33% & 38% \\ External audit of controls over financial reporting & 50% & 50% \\ External audit of financial statements & 38% & 29% \\ Formal fraud risk assessment & 50% & 38% \\ Fraud training for employees & 50% & 41% \\ Fraud training for managers/executives & 50% & 35% \\ Hotline & 50% & 50% \\ Independent audit committee & 48% & 20% \\ Intemal audit department & 50% & 46% \\ Job rotation/mandatory vacation & 44% & 23% \\ Management certification of financial statements & 50% & 43% \\ Management review & 50% & 50% \\ \hline Proactive data monitoringlanalysis & 58% & 52% \\ Rewards for whistleblowers & 50% & 12% \\ Surprise audits & 54% & 51% \end{tabular} b. Chart for part b. The data have been duplicated in the Student Work Area. Use conditional formatting data bars for the data in both columns. Sort this data by largest percentage reduction of time, and then as a secondary sort, by the largest percentage of loss reduction. Create a column chart comparing the two data ltems in part a, with each percentage reduction in a separate column for each control. Change the maximum bound of the percentages on the vertical axis to 60%. Include a descriptive chart title, axes labels, legend, and properly formatled axes. Which controls are the most effective? What control would you recommend for an organization for which you are seeking employment? Identify the most effective control based on both time and cost. Under which principle of control acilitios do you think this falls? Explain
Step by Step Solution
There are 3 Steps involved in it

Get step-by-step solutions from verified subject matter experts