

Question: Show how to do Part C in detail. Data visualization can be used to identify solutions and the impact of those solutions. Below are data
Show how to do Part C in detail.
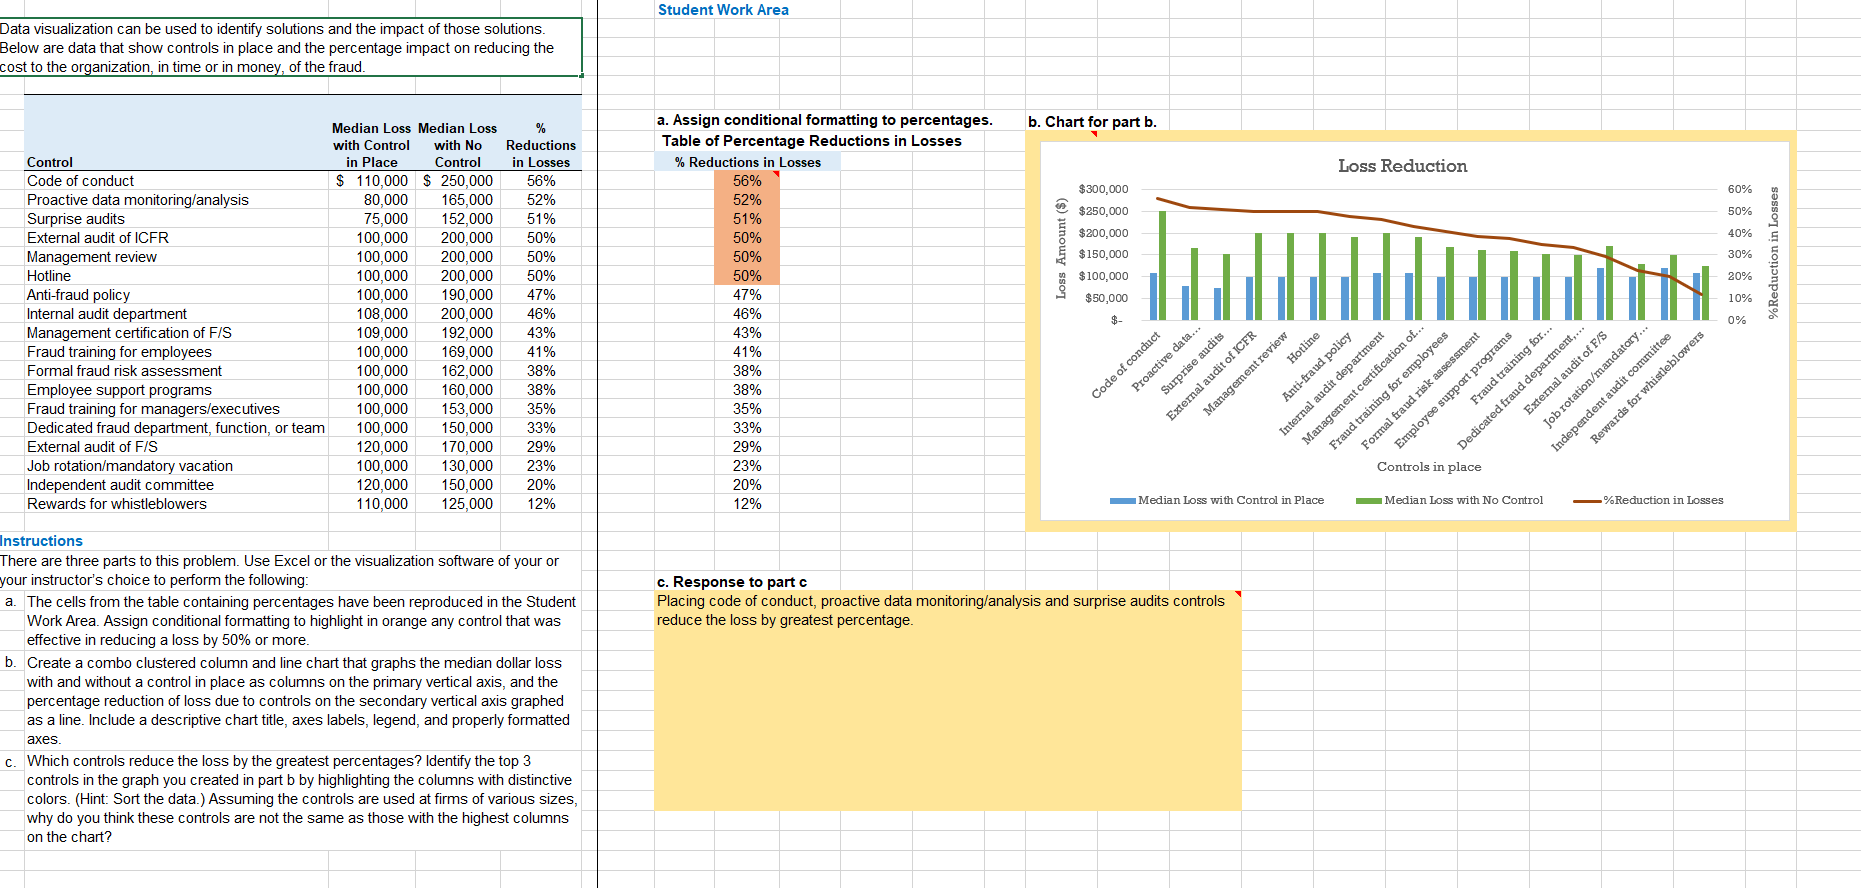
Data visualization can be used to identify solutions and the impact of those solutions. Below are data that show controls in place and the percentage Impact on reducing the cost to the or anzatlon In time or In mo Control Code of conduct Proactive data monitoring/analvsis Surprise audits External audit of ICFR Management review Hotline Ann-fraud policy Internal audit department Management certification of FIS Fraud training for employees Formal fraud risk assessment Employee support programs of the fraud. Median Loss with Control in Place Median Loss with No Reductions Control in Losses s 110,000 80,000 75,000 100,000 100,000 100,000 100,000 108,000 109,000 100,000 100,000 100,000 100,000 100,000 120,000 100,000 120,000 110000 s 250,000 165,000 152,000 200,000 200,000 200,000 190,000 200 , 192,000 169,000 162,000 160,000 153,000 150,000 170,000 130,000 150,000 125 ooo Student Work Area a. Assign conditional formatting to percentages. Table of Percentage Reductions in Losses % Reductions in Losses 52% 51% 46 % 43 % 41 % 33% 29% 23% 12% c. Response to part c b. Chart for part b. $300,000 $250,000 Smo,ooo $150,000 $100,000 eso,ooo 47 % 46 % 43 % 41 % 33% 29% 23% 12% Loss Reduction Controls in place Lo with No Control 1 ovo Fraud training for managers/executives Dedicated fraud department function or team External audit of F/S Job rotation}mandatory vacation Independent audit committee Rewards for whistleblowers Instructions witl Control in Place % Reduction in Losses There are three parts to this problem. use Excel or the visualization software of your or your Instructor's choice to perform the following: a. b. The cells from the table containing percentages have been reproduced in the Student Work Area. Assign conditional formatting to highlight in orange any control that was effective In reducing a loss by 50% or more. Create a combo clustered column and line chan that graphs the median dollar loss with and without a control in place as columns on the primary vertical axis, and the percentage reduction of loss due to controls on the secondary vertical axis graphed as a line. Include a descriptive chan title, axes labels, legend, and properly formatted Which controls reduce the bss by the greatest percentages? kdentify the top 3 controls in the graph you created in pan b by highlighting the columns with distinctive colors. (Hint: Son the data) Assuming the controls are used at firms of various Sizes, why do you think these controls are not the same as those with the highest columns on the chan? Placing code of conduct, proactive data monitoring/analysis and surprise audits controls reduce the loss by greatest percentage.
Step by Step Solution
There are 3 Steps involved in it

Get step-by-step solutions from verified subject matter experts