Question: A consumer preference study compares the effects of three different bottle designs (A, B, and on sales of a popular fabric softener. A completely randomized
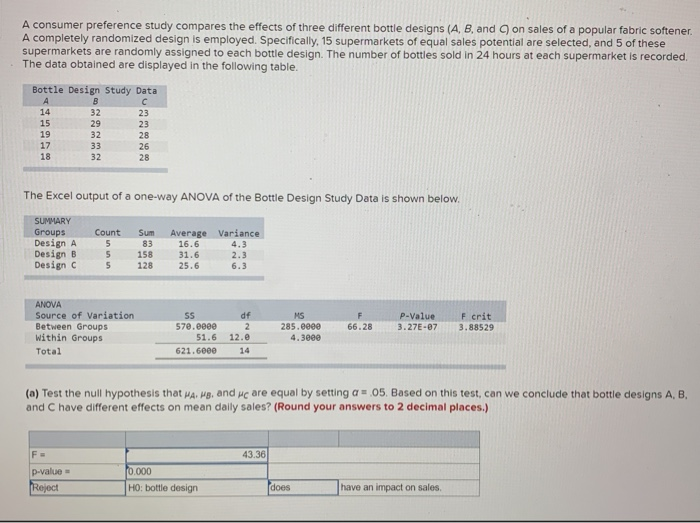
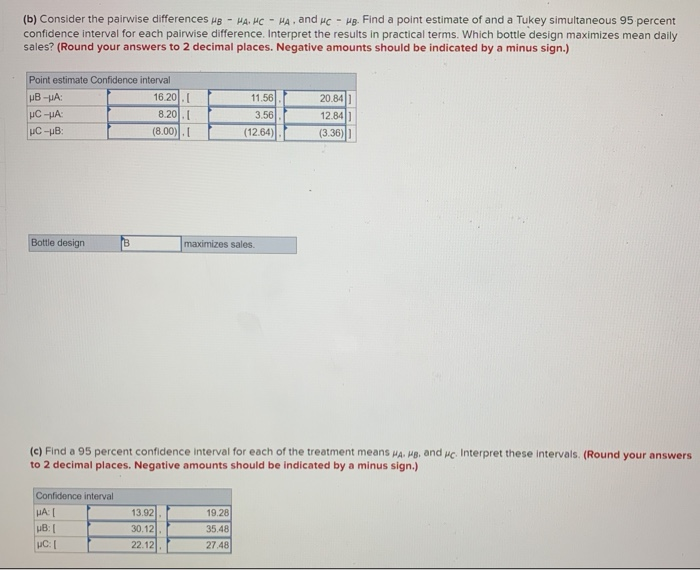
A consumer preference study compares the effects of three different bottle designs (A, B, and on sales of a popular fabric softener. A completely randomized design is employed. Specifically, 15 supermarkets of equal sales potential are selected, and 5 of these supermarkets are randomly assigned to each bottle design. The number of bottles sold in 24 hours at each supermarket is recorded. The data obtained are displayed in the following table. Bottle Design Study Data B 14 32 23 15 29 23 19 32 28 17 33 26 18 32 28 The Excel output of a one-way ANOVA of the Bottle Design Study Data is shown below. SUMMARY Groups Design A Design B Design Count 5 5 5 Sum 83 158 128 Average Variance 16.6 31.6 2.3 25.6 ANOVA Source of Variation Between Groups within Groups Total F 66.28 MS 285.eeee 4.3eee P-Value 3.27E-07 SS 57e.eeee 51.6 621.6000 F crit 3.88529 df 2 12.e 14 (a) Test the null hypothesis that ha. HB, and wc are equal by setting a = 05. Based on this test, can we conclude that bottle designs A, B, and C have different effects on mean daily sales? (Round your answers to 2 decimal places.) F= 43.36 p-value Reject 0.000 HO: bottle design does have an impact on sales (b) Consider the pairwise differences HB - HA. MC - WA, and wc - wg. Find a point estimate of and a Tukey simultaneous 95 percent confidence interval for each pairwise difference. Interpret the results in practical terms. Which bottle design maximizes mean daily sales? (Round your answers to 2 decimal places. Negative amounts should be indicated by a minus sign.) Point estimate Confidence interval B-A : 16 20.1 UC-A 8.2011 UC-B : (8.00). 11.56 3.561 (12.64) 20.84 12.84 (3.36) Bottle design B maximizes sales. (e) Find a 95 percent confidence interval for each of the treatment means A. me, and wc Interpret these intervals. (Round your answers to 2 decimal places. Negative amounts should be indicated by a minus sign.) Confidence interval A: WB: INC: 13.92 30.12 22.12 19.28 35.48 27.48 A consumer preference study compares the effects of three different bottle designs (A, B, and on sales of a popular fabric softener. A completely randomized design is employed. Specifically, 15 supermarkets of equal sales potential are selected, and 5 of these supermarkets are randomly assigned to each bottle design. The number of bottles sold in 24 hours at each supermarket is recorded. The data obtained are displayed in the following table. Bottle Design Study Data B 14 32 23 15 29 23 19 32 28 17 33 26 18 32 28 The Excel output of a one-way ANOVA of the Bottle Design Study Data is shown below. SUMMARY Groups Design A Design B Design Count 5 5 5 Sum 83 158 128 Average Variance 16.6 31.6 2.3 25.6 ANOVA Source of Variation Between Groups within Groups Total F 66.28 MS 285.eeee 4.3eee P-Value 3.27E-07 SS 57e.eeee 51.6 621.6000 F crit 3.88529 df 2 12.e 14 (a) Test the null hypothesis that ha. HB, and wc are equal by setting a = 05. Based on this test, can we conclude that bottle designs A, B, and C have different effects on mean daily sales? (Round your answers to 2 decimal places.) F= 43.36 p-value Reject 0.000 HO: bottle design does have an impact on sales (b) Consider the pairwise differences HB - HA. MC - WA, and wc - wg. Find a point estimate of and a Tukey simultaneous 95 percent confidence interval for each pairwise difference. Interpret the results in practical terms. Which bottle design maximizes mean daily sales? (Round your answers to 2 decimal places. Negative amounts should be indicated by a minus sign.) Point estimate Confidence interval B-A : 16 20.1 UC-A 8.2011 UC-B : (8.00). 11.56 3.561 (12.64) 20.84 12.84 (3.36) Bottle design B maximizes sales. (e) Find a 95 percent confidence interval for each of the treatment means A. me, and wc Interpret these intervals. (Round your answers to 2 decimal places. Negative amounts should be indicated by a minus sign.) Confidence interval A: WB: INC: 13.92 30.12 22.12 19.28 35.48 27.48