

Question: nent chpt 120 Saved Help Sav A consumer preference study compares the effects of three different bottle designs (A, B, and on sales of a
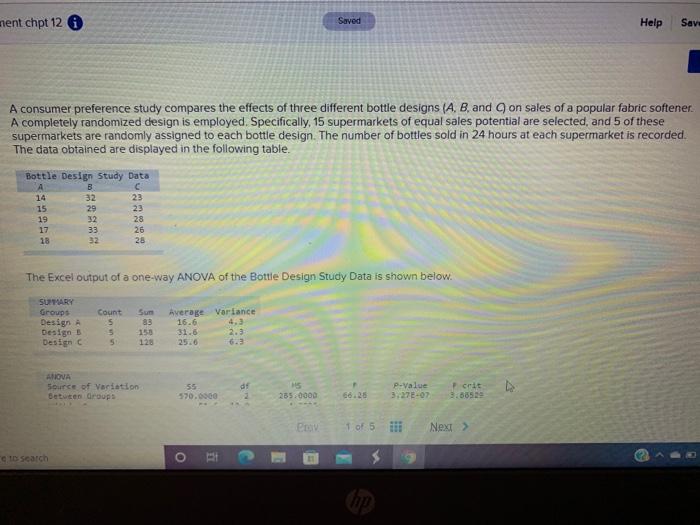
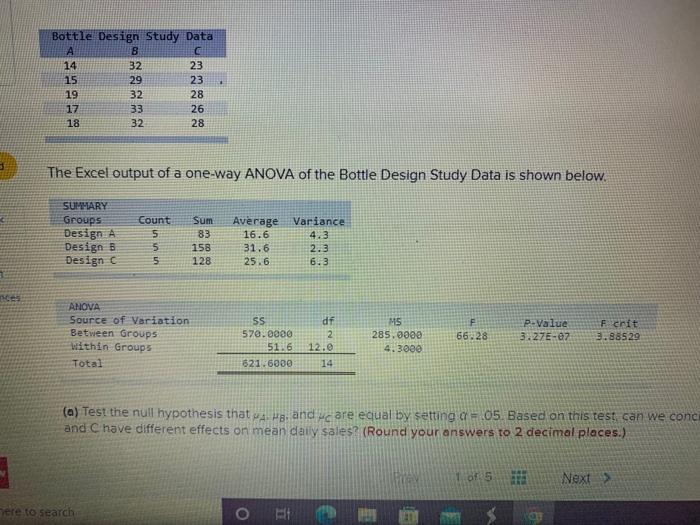
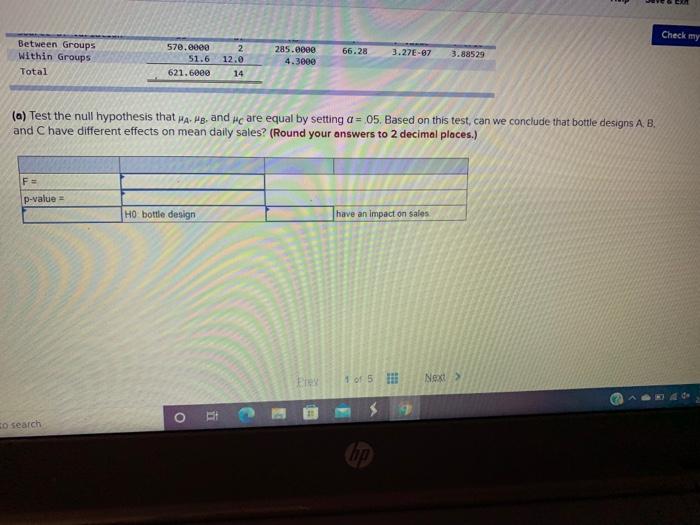
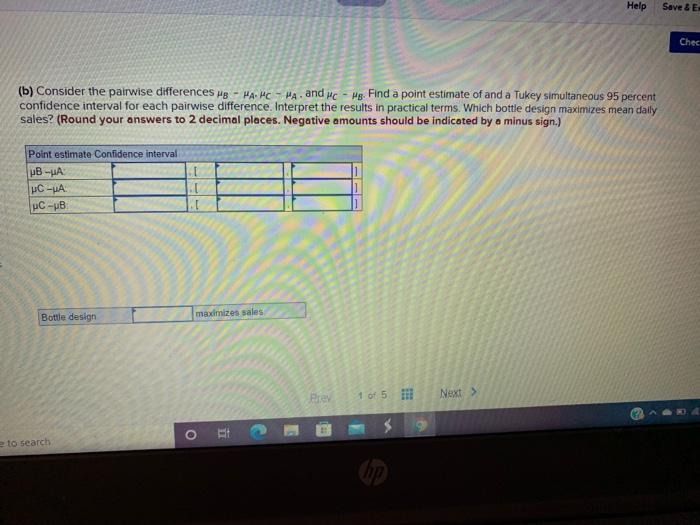
nent chpt 120 Saved Help Sav A consumer preference study compares the effects of three different bottle designs (A, B, and on sales of a popular fabric softener. A completely randomized design is employed. Specifically, 15 supermarkets of equal sales potential are selected, and 5 of these supermarkets are randomly assigned to each bottle design. The number of bottles sold in 24 hours at each supermarket is recorded. The data obtained are displayed in the following table. Bottle Design Study Data A B 14 32 23 15 29 23 19 32 28 17 33 26 18 32 28 The Excel output of a one-way ANOVA of the Bottle Design Study Data is shown below. SUMARY Groups Design Design Design Count 5 5 5 Sun 83 158 126 Average Variance 16.6 4,3 31.6 2.3 25.6 6. ANOVA Source of Variation Betuten drops df 55 590.000 285.0000 66.28 p-value crat 3.272-073.58529 1 of 5 fif Next > search Bottle Design Study Data 8 C 14 32 23 15 29 23 19 32 28 17 33 26 18 32 28 1 The Excel output of a one-way ANOVA of the Bottle Design Study Data is shown below. SUMMARY Groups Design A Design B Design Count 5 5 5 Sum 83 158 128 Average 16.6 31.6 25.6 Variance 4.3 2.3 6.3 ces ANOVA Source of Variation Between Groups within Groups Total SS 570.0000 5116 621.6000 df 2 12.0 14 MS 285.0000 4.3000 P.Value 3:27E-7 F crit 3.88529 66.28 (a) Test the null hypothesis that waand wc are equal by setting a-05. Based on this test can we conc and C have different effects on mean daily sales? (Round your answers to 2 decimal places.) - 1 of 5 Next > Tere to search o 0 4 Check my 66.28 Between Groups Within Groups Total 3.27E-67 570.0000 51.6 621.6000 285.000e 4.3000 3.88529 2 12.0 14 (a) Test the null hypothesis that was, and we are equal by setting a = 05. Based on this test can we conclude that bottle designs A, B, and Chave different effects on mean daily sales? (Round your answers to 2 decimal places.) F= p-value = HO bottle design have an impact on sales El 1 of 5 Next > o so search Help Save & E Chec (b) Consider the pairwise differences Hg - MAMC - HA. and Mc - Pg. Find a point estimate of and a Tukey simultaneous 95 percent confidence interval for each pairwise difference. Interpret the results in practical terms. Which bottle design maximizes mean daily sales? (Round your answers to 2 decimal places. Negative amounts should be indicated by a minus sign.) Point estimate Confidence interval p - C-A C-UB Botte design maximizes sales Prev 1 of 5 il Next > O i e to search Che (c) Find a 95 percent confidence interval for each of the treatment means A.Hg, and she Interpret these intervals. (Round your answers to 2 decimal places. Negative amounts should be indicated by a minus sign.) Confidence interval UA BI luci 1 of 5 II Next > O i ere to search op
Step by Step Solution
There are 3 Steps involved in it

Get step-by-step solutions from verified subject matter experts