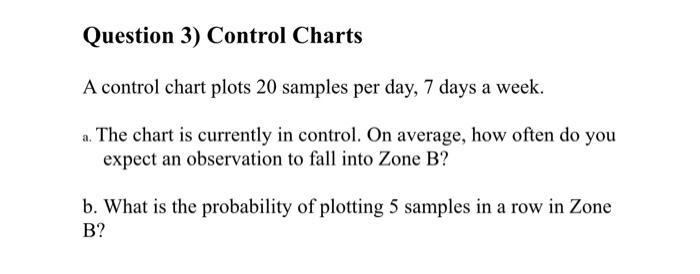
Question: Question 3) Control Charts A control chart plots 20 samples per day, 7 days a week. a. The chart is currently in control. On average,

Question 3) Control Charts A control chart plots
Question 3) Control Charts A control chart plots 20 samples per day, 7 days a week. a. The chart is currently in control. On average, how often do you expect an observation to fall into Zone B? b. What is the probability of plotting 5 samples in a row in Zone B? Control Chart Factors Sample Size Factor for X bar-chart Factors for R-chart Factors for R-chart D3 1.880 0.000 n A2 D4 2 3.267 3 1.023 0.000 2.575 4 0.729 2.282 5 0.577 2.114 0.000 0.000 0.000 0.076 6 0.483 7 0.419 0.373 2.004 1.924 1.864 8 0.136 9 0.337 0.184 1.816 10 0.308 0.223 1.777 11 0.285 0.256 1.744 12 0.266 0.283 1.717 1.693 13 0.249 0.307

Step by Step Solution

There are 3 Steps involved in it

1 Expert Approved Answer
Step: 1 Unlock blur-text-image
Question Has Been Solved by an Expert!

Get step-by-step solutions from verified subject matter experts

Step: 2 Unlock
Step: 3 Unlock

Students Have Also Explored These Related General Management Questions!