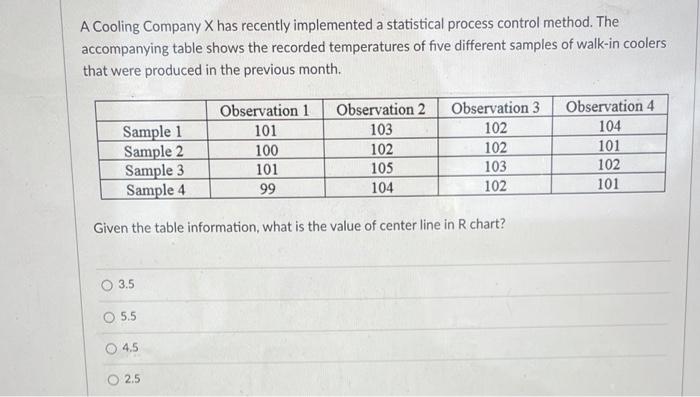
Question: A Cooling Company X has recently implemented a statistical process control method. The accompanying table shows the recorded temperatures of five different samples of walk-in

A Cooling Company X has recently implemented a
A Cooling Company X has recently implemented a statistical process control method. The accompanying table shows the recorded temperatures of five different samples of walk-in coolers that were produced in the previous month. Sample 1 Sample 2 Sample 3 Sample 4 Observation 1 101 100 101 99 Observation 2 103 102 105 104 Observation 3 102 102 103 102 Observation 4 104 101 102 101 Given the table information, what is the value of center line in R chart? O 3.5 O 5.5 4,5 O 2.5

Step by Step Solution

There are 3 Steps involved in it

1 Expert Approved Answer
Step: 1 Unlock blur-text-image
Question Has Been Solved by an Expert!

Get step-by-step solutions from verified subject matter experts

Step: 2 Unlock
Step: 3 Unlock

Students Have Also Explored These Related General Management Questions!