

Question: b. Assume these samples are sufficient, use the data to determine control limits for the control chart. Is the process variability in control? c. Use
b. Assume these samples are sufficient, use the data to determine control limits for the control chart. Is the process variability in control? c. Use the data to determine control limits for the other control chart. Is the process mean in control?
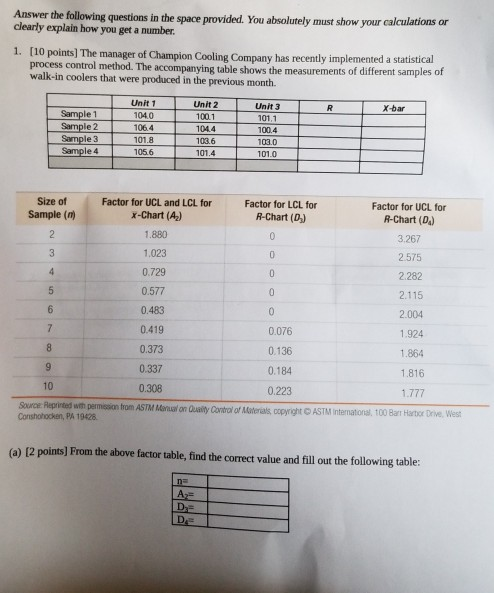
Answer the following questions in the space provided. You absolutely must show your calculations or clearly explain how you get a number. 1. [10 points) The manager of Champion Cooling Company has recently implemented a statistical process control method. The accompanying table shows the measurements of different samples of walk-in coolers that were produced in the previous month. x-bar T Sample 1 Sample 2 Sample 3 Sample 4 Unit 1 1040 1064 101.8 1056 Unit 2 1001 1044 1036 101.4 Unit) 101.1 100.4 1030 1010 Size of Sample (m) Factor for UCL and LCL for X-Chart (4) Factor for LCL for R-Chart (0) 1.880 1.023 Factor for UCL for R-Chart (D) 3.267 2.575 2.282 2.115 0.729 0.577 0.483 2.004 0.419 0.076 1.924 0.373 0.136 1.864 0.337 0.308 Source: Heprinted with permission from ASTM M Consocken, PA 19628 0.184 1.816 0.223 1.777 o n Only Control of Materials copyright ASTM international, 100 BT Hartor Drive West (a) [2 points) From the above factor table, find the correct value and fill out the following table: = A= DE DEStep by Step Solution
There are 3 Steps involved in it
1 Expert Approved Answer
Step: 1 Unlock

Question Has Been Solved by an Expert!
Get step-by-step solutions from verified subject matter experts
Step: 2 Unlock
Step: 3 Unlock