

Question: b. Assume these samples are sufficient, use the data to determine control limits for the control chart. Is the process variability in control? c. use
b. Assume these samples are sufficient, use the data to determine control limits for the control chart. Is the process variability in control?
c. use the data to determine control limits for the other control chart. Is the process mean in control?
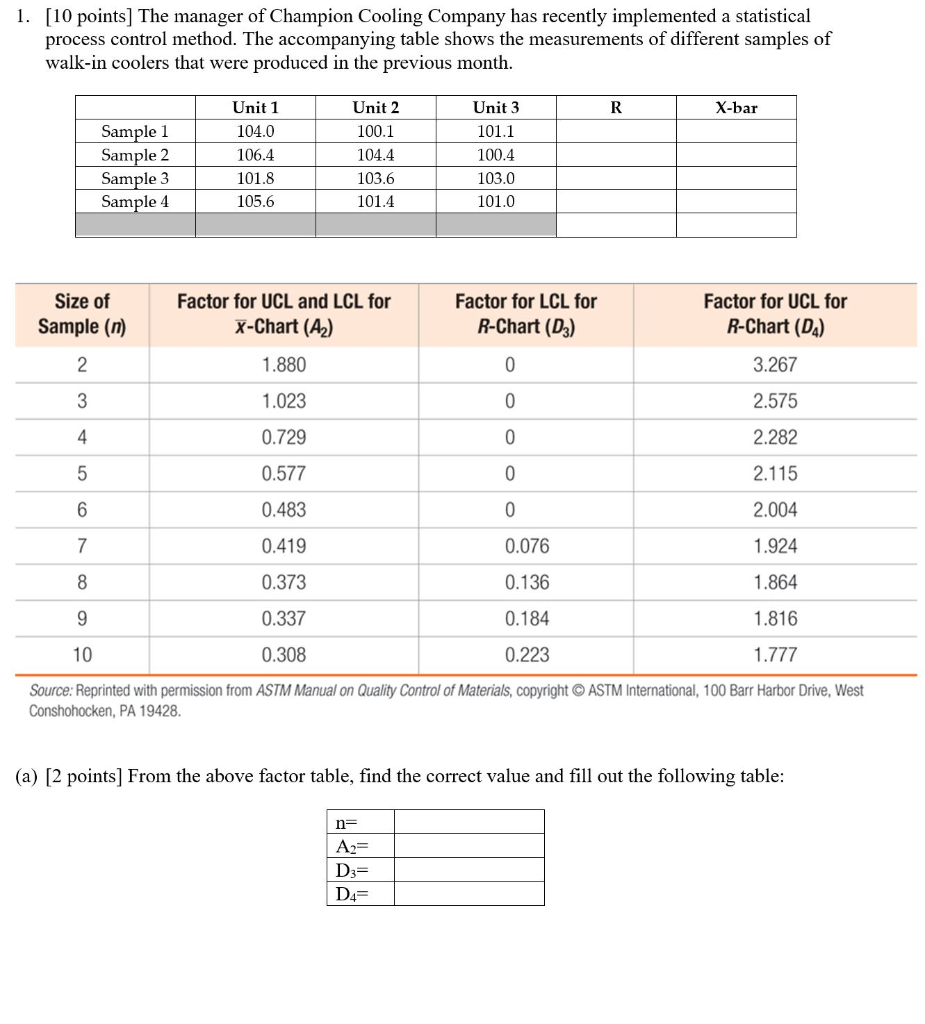
1. [10 points) The manager of Champion Cooling Company has recently implemented a statistical process control method. The accompanying table shows the measurements of different samples of walk-in coolers that were produced in the previous month. R X -bar Sample 1 Sample 2 Sample 3 Sample 4 Unit 1 104.0 106.4 101.8 105.6 Unit 2 100.1 104.4 103.6 101.4 Unit 3 101.1 100.4 103.0 101.0 Size of Sample (n) Factor for UCL and LCL for X-Chart (A2) Factor for LCL for R-Chart (D3) Factor for UCL for R-Chart (D) 1.880 3.267 2.575 2.282 1.023 0.729 0.577 0.483 0 2.115 2.004 0.419 0.076 1.924 8 0.373 0.136 1.864 0.337 0.184 1.816 10 0.308 0.223 1.777 Source: Reprinted with permission from ASTM Manual on Quality Control of Materials, copyright ASTM International, 100 Barr Harbor Drive, West Conshohocken, PA 19428. (a) [2 points] From the above factor table, find the correct value and fill out the following table: n= A2= D3= D4=Step by Step Solution
There are 3 Steps involved in it
1 Expert Approved Answer
Step: 1 Unlock

Question Has Been Solved by an Expert!
Get step-by-step solutions from verified subject matter experts
Step: 2 Unlock
Step: 3 Unlock