

Question: a) Create plots that illustrate the relationship between mortality rate and each of the air pollution measures (hc, so2, and nox). Describe what you see.
a) Create plots that illustrate the relationship between mortality rate and each of the air pollution
measures (hc, so2, and nox). Describe what you see.
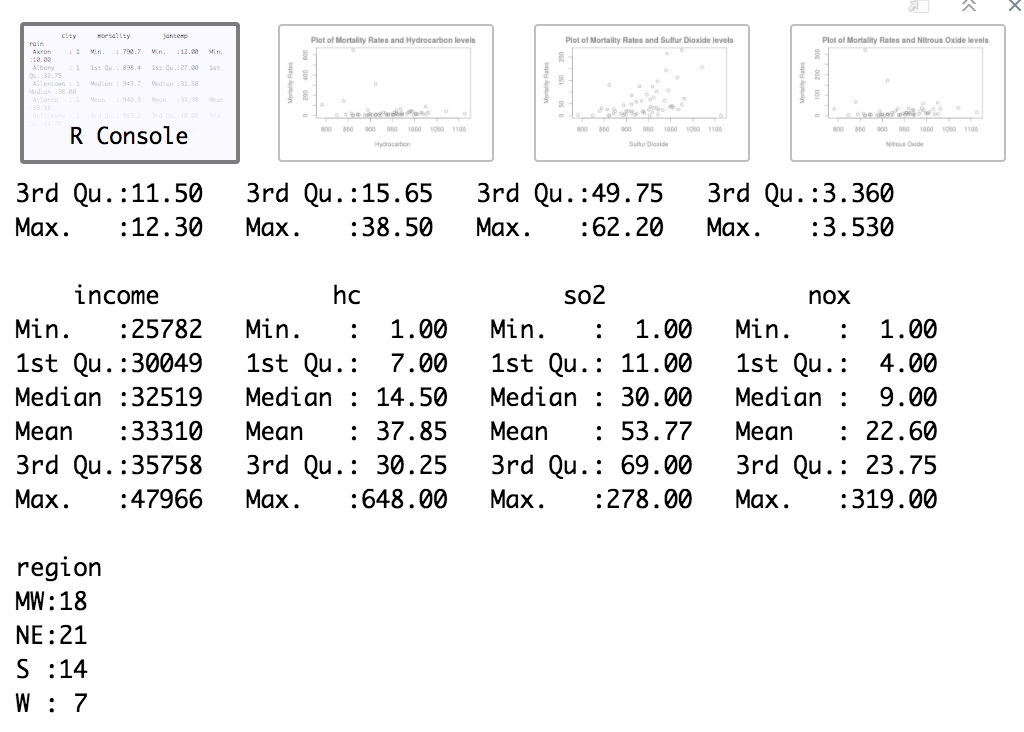
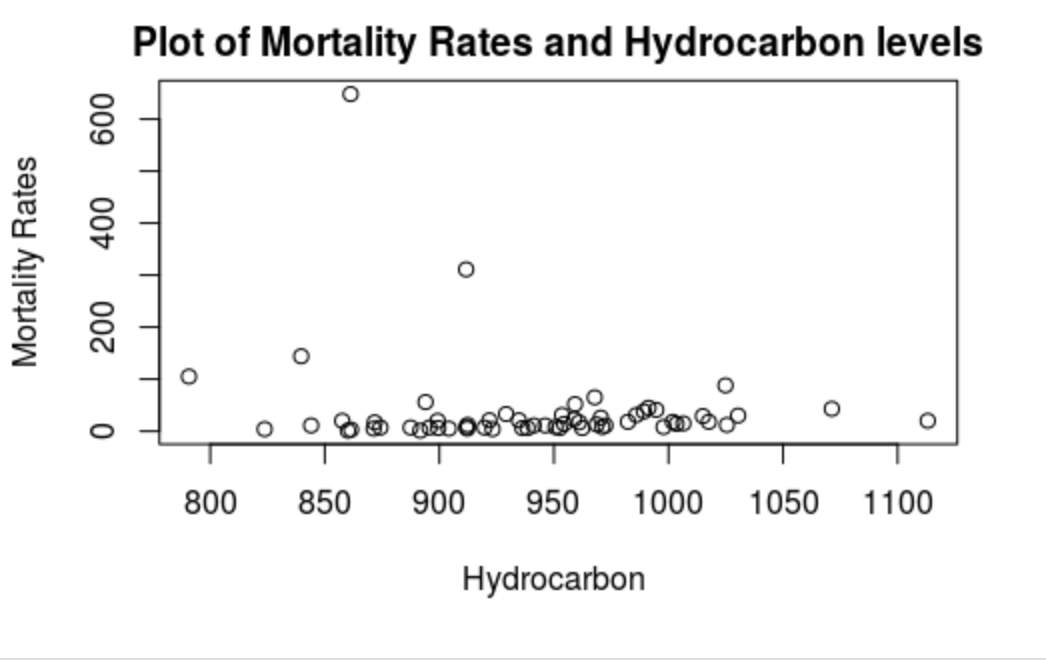
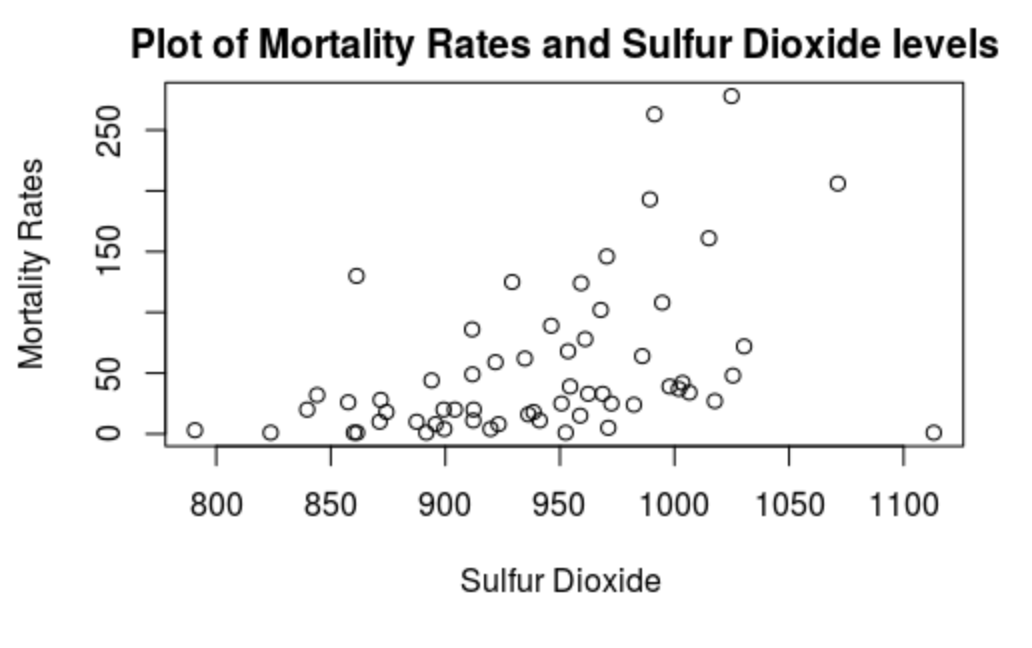
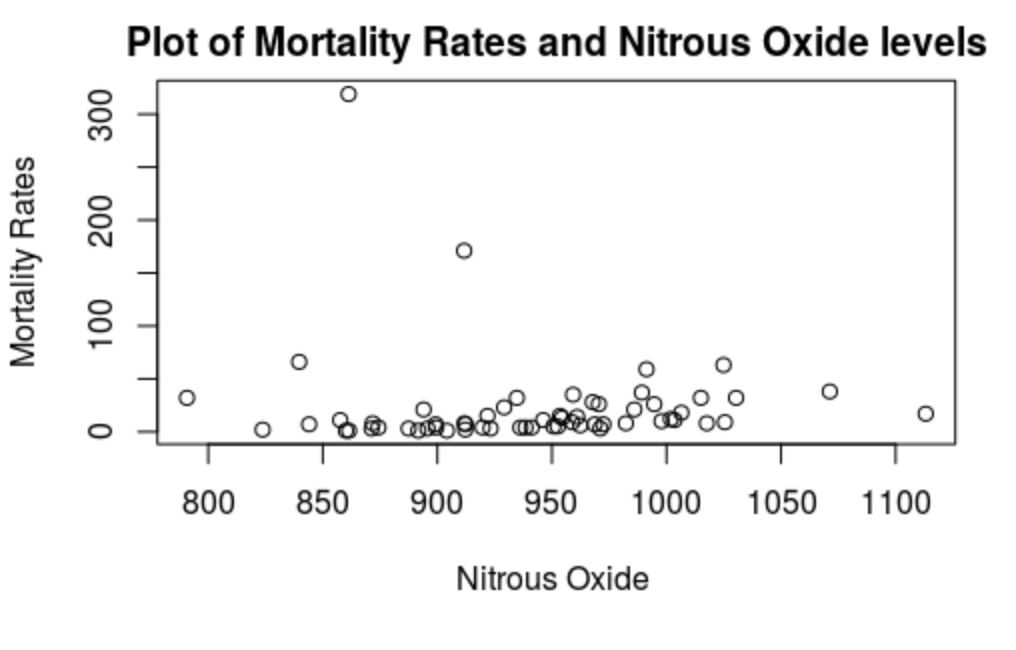
city mortal ity fantemp rain Plot of Mortality Rates and Hydrocarbon levels Akron : 1 Min. : 790.7 Min. :12.09 Min. Plot of Mortality Rates and Sulfur Dioxide levels Plot of Mortality Rates and Nitrous Oxide levels Albany 1s: Qu.: 898.4 1st Qu. :27.09 1se Qu . :32.73 Allentown Median :38.08 MedCan : 943.7 Median :31.59 940.3 : 33.98 Mortality Rate 20D 400 600 Mortal Mortality Rates 100 200 R Console 800 850 900 950 1000 1060 1100 800 850 960 1009 1060 1100 800 850 900 950 1000 8060 1100 Sulfur Dioxide 3rd Qu. : 11.50 3rd Qu. : 15.65 3rd Qu. :49.75 3rd Qu. :3.360 Max . : 12. 30 Max . : 38.50 Max . : 62 . 20 Max . : 3.530 income hc so2 nox Min. : 25782 Min. : 1.00 Min. 1.00 Min. 1.00 1st Qu. : 30049 1st Qu. : 7.00 1st Qu. : 11.00 1st Qu. : 4.00 Median : 32519 Median : 14.50 Median : 30.00 Median : 9.00 Mean : 33310 Mean : 37.85 Mean : 53.77 Mean : 22.60 3rd Qu. :35758 3rd Qu. : 30.25 3rd Qu. : 69.00 3rd Qu. : 23.75 Max. : 47966 Max . : 648 .00 Max . : 278.00 Max. : 319.00 region MW : 18 NE : 21 S : 14 W : 7\fMortality Rates 1 50 250 50 Plot of Mortality Rates and Sulfur Dioxide levels 800 850 900 950 1000 1050 1100 Sulfur Dioxide \f
Step by Step Solution
There are 3 Steps involved in it

Get step-by-step solutions from verified subject matter experts