

Question: A cube is shown in Figure 1. Identify the suitable OLAP operation for the given scenarios. Also explain the usage of a particular operation selected
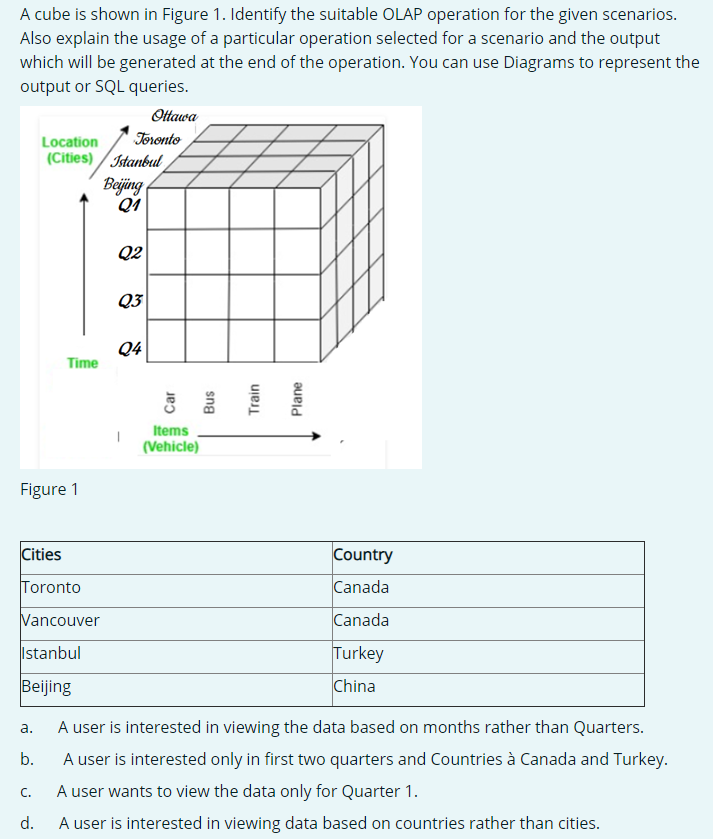
A cube is shown in Figure 1. Identify the suitable OLAP operation for the given scenarios. Also explain the usage of a particular operation selected for a scenario and the output which will be generated at the end of the operation. You can use Diagrams to represent the output or SQL queries. Ottawa Location Toronto (Cities) Istanbul Beijing 01 Q2 03 04 Time Car Bus Train Plane 1 Items (Vehicle) Figure 1 Cities Country Toronto Canada Vancouver Canada Istanbul Turkey Beijing China a. b. A user is interested in viewing the data based on months rather than Quarters. A user is interested only in first two quarters and Countries Canada and Turkey. A user wants to view the data only for Quarter 1. A user is interested in viewing data based on countries rather than cities. C. d
Step by Step Solution
There are 3 Steps involved in it

Get step-by-step solutions from verified subject matter experts