

Question: a. Determine the expected return and beta for the portfolio in the popup window: :: b. Given the foregoing information, draw the security market line
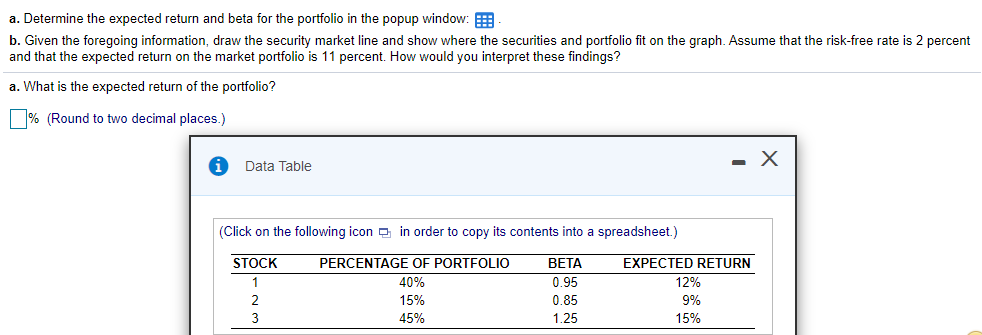
a. Determine the expected return and beta for the portfolio in the popup window: :: b. Given the foregoing information, draw the security market line and show where the securities and portfolio fit on the graph. Assume that the risk-free rate is 2 percent and that the expected return on the market portfolio is 11 percent. How would you interpret these findings? a. What is the expected return of the portfolio? % (Round to two decimal places.) Data Table (Click on the following icon e in order to copy its contents into a spreadsheet.) STOCK 1 PERCENTAGE OF PORTFOLIO 40% 15% 45% BETA 0.95 0.85 1.25 EXPECTED RETURN 12% 9% 15% 2 3
Step by Step Solution
There are 3 Steps involved in it
1 Expert Approved Answer
Step: 1 Unlock

Question Has Been Solved by an Expert!
Get step-by-step solutions from verified subject matter experts
Step: 2 Unlock
Step: 3 Unlock