

Question: (Security market line) a. Determine the expected return and beta for the portfolio in the popup Window: b. Given the foregoing information, draw the security
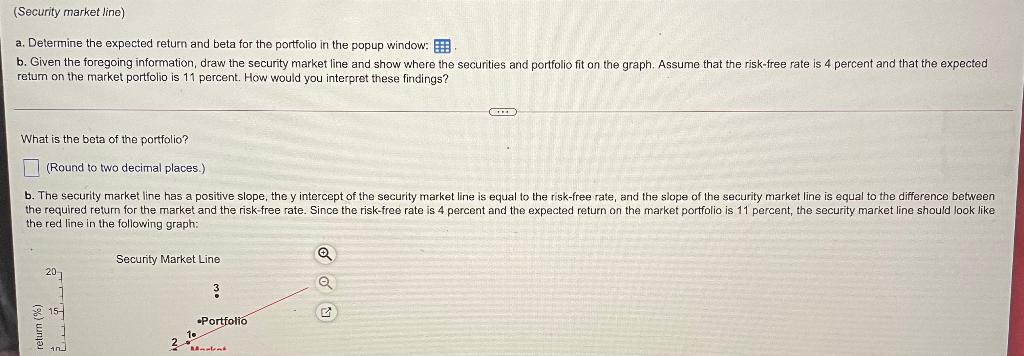
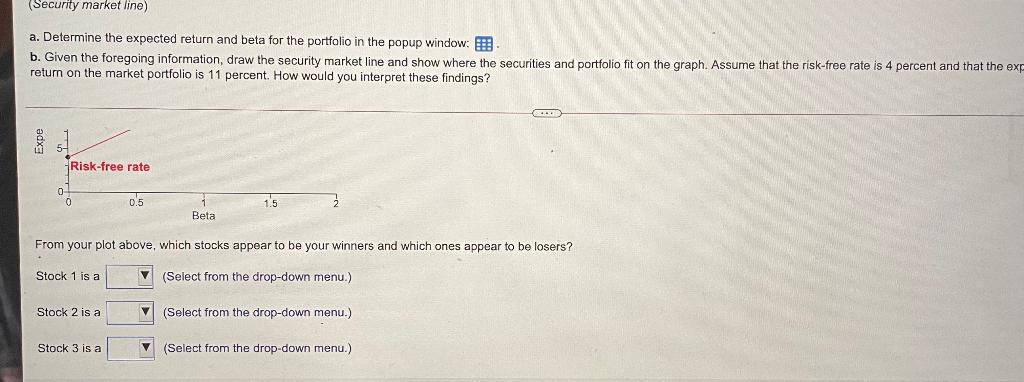
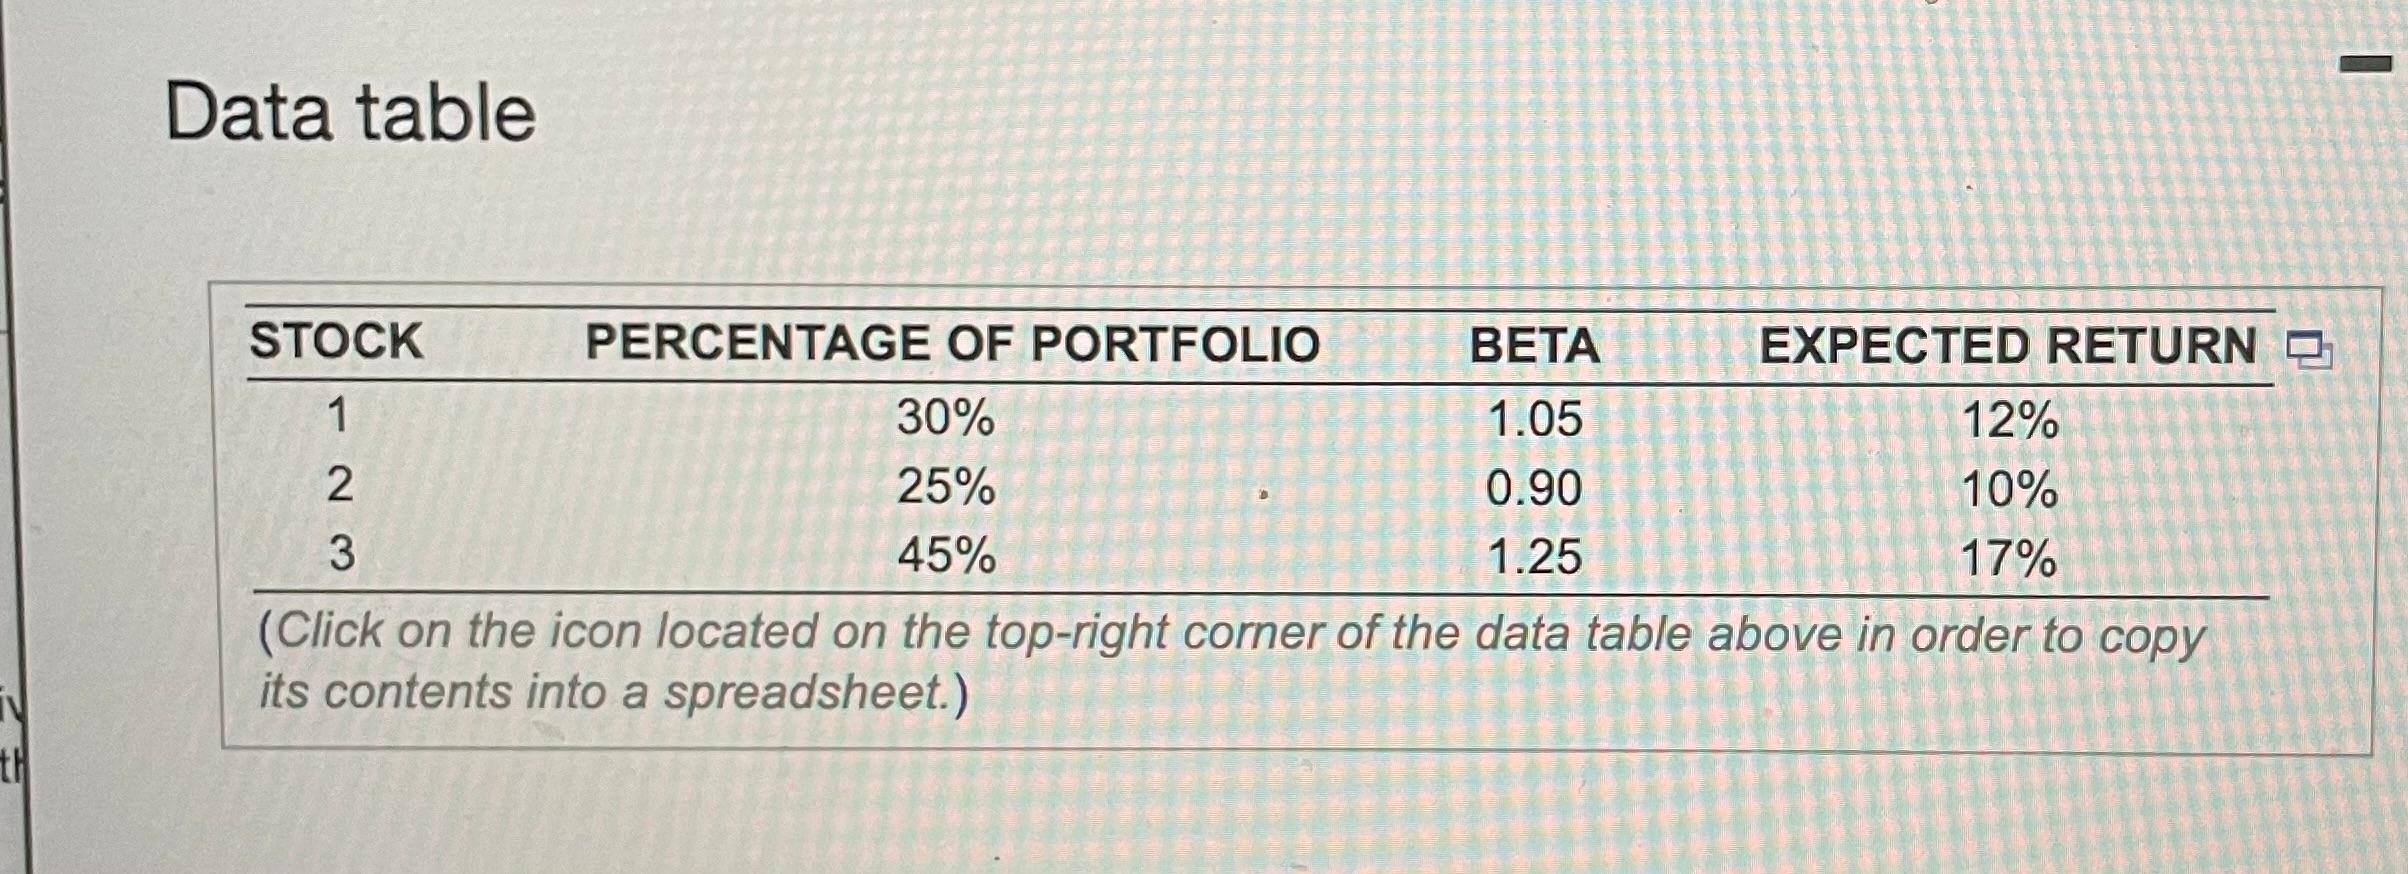
(Security market line) a. Determine the expected return and beta for the portfolio in the popup Window: b. Given the foregoing information, draw the security market line and show where the securities and portfolio fit on the graph. Assume that the risk-free rate is 4 percent and that the expected retum on the market portfolio is 11 percent. How would you interpret these findings? Gm What is the beta of the portfolio? (Round to two decimal places.) b. The security market line has a positive slope, the y intercept of the security market line is equal to the risk-free rate, and the slope of the security market line is equal to the difference between the required return for the market and the risk-free rate. Since the risk-free rate is 4 percent and the expected return on the market portfolio is 11 percent, the security market line should look like the red line in the following graph: Security Market Line 3 15- Portfolio eturn 2. (Security market line) a. Determine the expected return and beta for the portfolio in the popup Window: b. Given the foregoing information, draw the security market line and show where the securities and portfolio fit on the graph. Assume that the risk-free rate is 4 percent and that the ex- retum on the market portfolio is 11 percent. How would you interpret these findings? Risk-free rate 0 0 0.5 11 Beta 1.5 From your plot above, which stocks appear to be your winners and which ones appear to be losers? Stock 1 is a (Select from the drop-down menu.) Stock 2 is a (Select from the drop-down menu.) Stock 3 is a (Select from the drop-down menu.) Data table STOCK PERCENTAGE OF PORTFOLIO BETA EXPECTED RETURN O 1 30% 1.05 12% 2 25% 0.90 10% 3 45% 1.25 17% (Click on the icon located on the top-right corner of the data table above in order to copy its contents into a spreadsheet.) TV th
Step by Step Solution
There are 3 Steps involved in it

Get step-by-step solutions from verified subject matter experts