

Question: A. Direction. Using the data given below, give the corresponding details of the following. Show your solution. 62 50 63 52 54 1. Mean
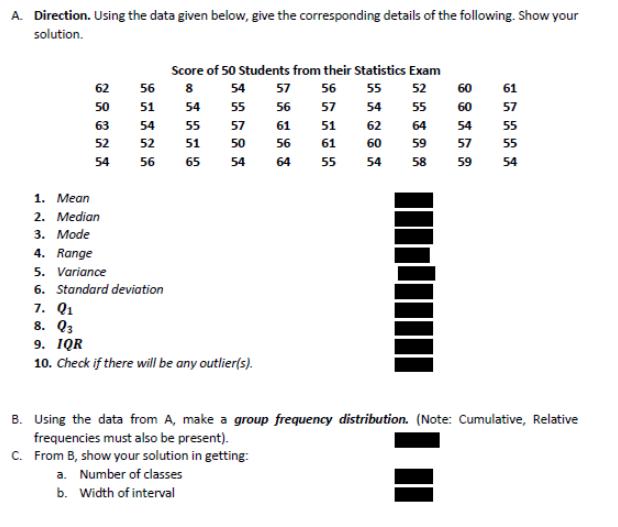
A. Direction. Using the data given below, give the corresponding details of the following. Show your solution. 62 50 63 52 54 1. Mean 2. Median 3. Mode 56 51 54 52 56 4. Range 5. Variance 6. Standard deviation 7. Q 8. Q3 Score of 50 Students from their Statistics Exam 8 54 55 54 55 54 55 57 51 50 65 54 64 9. IQR 10. Check if there will be any outlier(s). 57 56 60 61 56 57 55 60 57 51 62 64 54 55 61 60 59 57 55 55 54 58 59 54 C. From B, show your solution in getting: a. Number of classes b. Width of interval 75554 61 56 52 B. Using the data from A, make a group frequency distribution. (Note: Cumulative, Relative frequencies must also be present).
Step by Step Solution
3.42 Rating (158 Votes )
There are 3 Steps involved in it

Get step-by-step solutions from verified subject matter experts