

Question: A FISHBONE DIAGRAM IS WHAT I NEED HELP WITH PLEASE. Thank you! (c) Please draw the fishbone diagram and Pareto diagram for the situation below.
A FISHBONE DIAGRAM IS WHAT I NEED HELP WITH PLEASE. Thank you! 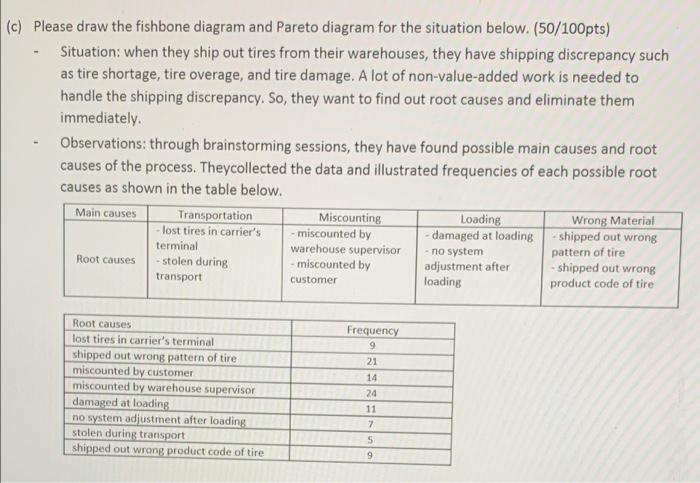
(c) Please draw the fishbone diagram and Pareto diagram for the situation below. (50/100pts) - Situation: when they ship out tires from their warehouses, they have shipping discrepancy such as tire shortage, tire overage, and tire damage. A lot of non-value-added work is needed to handle the shipping discrepancy. So, they want to find out root causes and eliminate them immediately. Observations: through brainstorming sessions, they have found possible main causes and root causes of the process. Theycollected the data and illustrated frequencies of each possible root causes as shown in the table below. Main causes Transportation Miscounting Loading Wrong Material - lost tires in carrier's - miscounted by - damaged at loading-shipped out wrong warehouse supervisor pattern of tire - stolen during - miscounted by adjustment after - shipped out wrong transport loading product code of tire terminal - no system Root causes customer Root causes lost tires in carrier's terminal shipped out wrong pattern of tire miscounted by customer miscounted by warehouse supervisor damaged at loading no system adjustment after loading stolen during transport shipped out wrong product code of tire Frequency 9 21 14 24 11 7 9
Step by Step Solution
There are 3 Steps involved in it
1 Expert Approved Answer
Step: 1 Unlock

Question Has Been Solved by an Expert!
Get step-by-step solutions from verified subject matter experts
Step: 2 Unlock
Step: 3 Unlock