

Question: a) For the given data, the x double overbarx =_____ hours (round your response to three decimal places). For the given data, the mean range=_____
a) For the given data, the x double overbarx =_____ hours(round your response to three decimal places).
For the given data, the mean range=_____ (round your response to three decimal places).
With z=3, the control limits for the mean chartare:
UCL Subscript x overbar UCLx=_____ hours (round your response to three decimal places).
LCL Subscript x overbar LCLx= _____ hours (round your response to three decimal places).
The control limits for the range chart are:
UCL Subscript Upper RUCLR=_____hours (round your response to two decimal places).
LCL Subscript Upper RLCLR=____ hours (round your response to two decimal places).
B)
Do the samples for hours 26 through 30 indicate that the process is in control?
1- If any sample mean falls outside the upper or lower control limits, the process is not in control. Based on the
x overbarx-chart,
the process has been
(IN CONTROL or OUT OF CONTROL)?
2- If any sample range falls outside the upper or lower control limits, the process is not in control. Based on the R-chart, the process has been
(IN CONTROL or OUT OF CONTROL)?
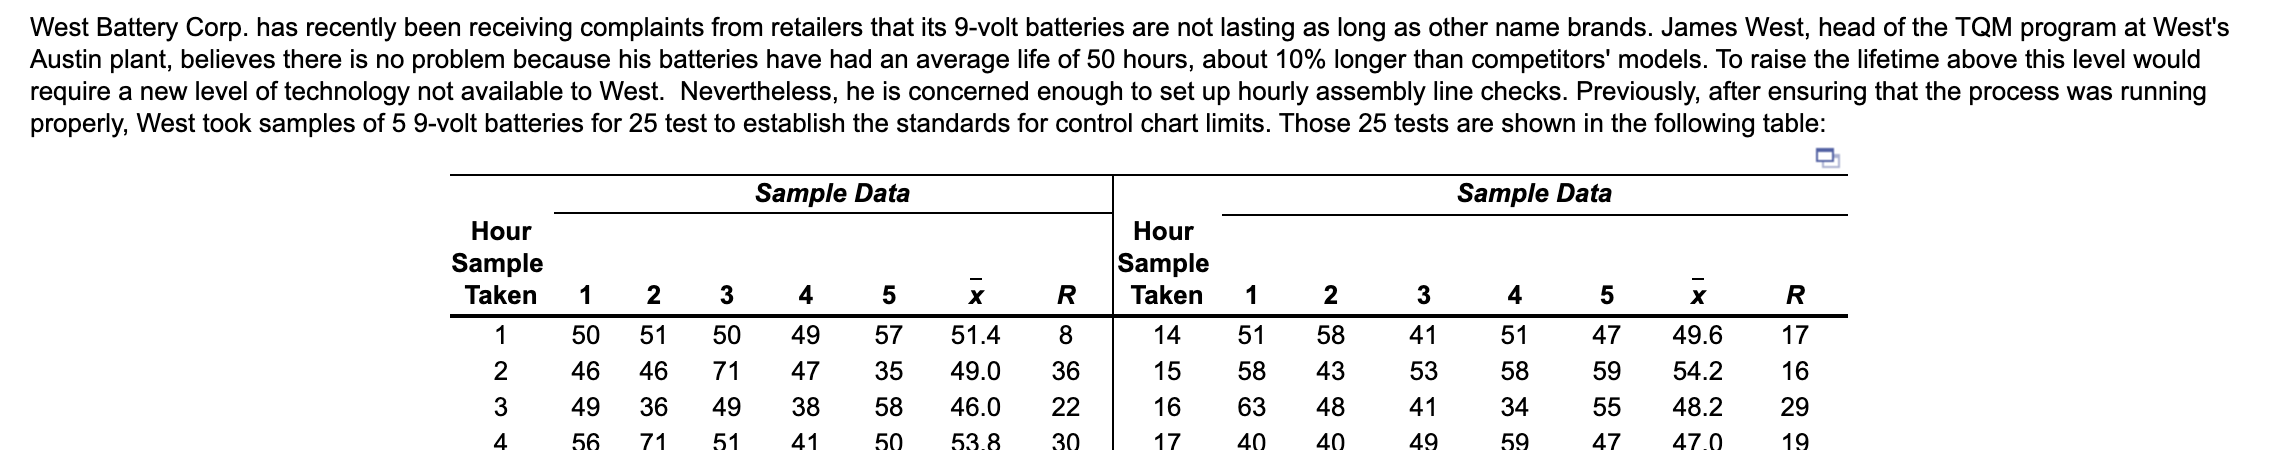
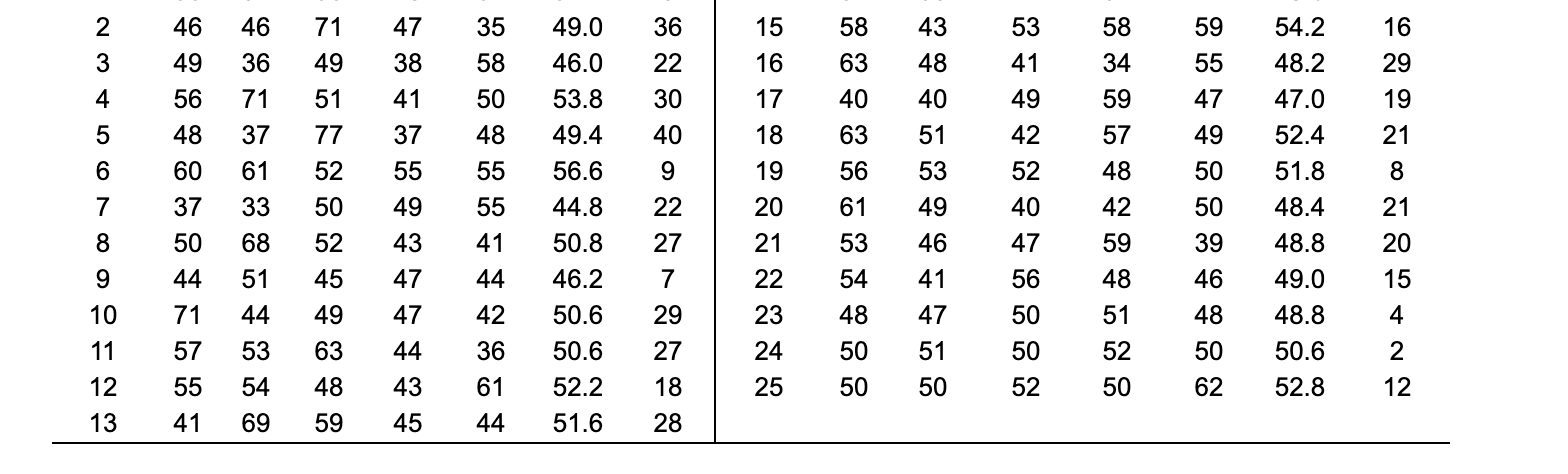
West Battery Corp. has recently been receiving complaints from retailers that its 9-volt batteries are not lasting as long as other name brands. James West, head of the TQM program at West's Austin plant, believes there is no problem because his batteries have had an average life of 50 hours, about 10% longer than competitors' models. To raise the lifetime above this level would require a new level of technology not available to West. Nevertheless, he is concerned enough to set up hourly assembly line checks. Previously, after ensuring that the process was running properly, West took samples of 5 9-volt batteries for 25 test to establish the standards for control chart limits. Those 25 tests are shown in the following table: Sample Data Sample Data Hour Sample Taken 5 1 50 46 49 56 AWN 2 51 46 36 71 3 50 71 49 51 4 49 47 38 41 5 57 35 58 50 51.4 49.0 46.0 53. 8 Hour Sample R Taken 8 14 36 15 22 16 30 17 1 51 58 63 40 2 58 43 48 40 3 4 41 51 53 58 41 34 4959 59 55 47 X 49.6 54.2 48.2 47.0 R 17 16 29 19 6 141 50 31 48 55 | 234567890H 46 46 71 47 35 49.0 49 36 49 38 58 46.0 56 71 51 53.8 3777 49.4 52 | 55 56.6 | 33 50 | 49 44.8 50 68 52 43 41 50.8 27 44 51 45 | 47 46.2 71 44 49 47 42 50.6 57 53 63 44 36 50.6 1255 54 48 436152. 218 13 41 69 59 45 44 51.6 28 55 40 163 156 20 61 21 53 225 4 888%987988 40 51 53 49 46 41 47 51 50 49 42 52 40 47 56 50 50 52 59 57 48 42 59 48 51 52 50 59 54.2 55 48.2 47 47.0 49 52.4 50 51.8 50 48.4 39 48.8 46 49.0 48 48. 8 50 50. 6 62 52.8 | 16 29 19 21 8 21 20 15 4 2 12 | 50 50 125Step by Step Solution
There are 3 Steps involved in it

Get step-by-step solutions from verified subject matter experts