

Question: a. For the phase diagram given in fig. I i. Draw free energy vs. composition plots for T1 and T2. ii. Examine the phase diagram
a. For the phase diagram given in fig. I i. Draw free energy vs. composition plots for T1 and T2. ii. Examine the phase diagram to determine if there are any construction errors. If you find errors, identify them and briefly explain why they are errors. a. i. Using the plot in fig.2 show the location of an alloy with the composition 50%A, 30%B and20%C and find the percentage of the a phase. ii. Complete the construction of the isothermal ternary section in fig.2. Note that some, but not all single phase regions are given. iii. In a ternary isothermal section in a two-phase region tie lines can not cross. Explain why?
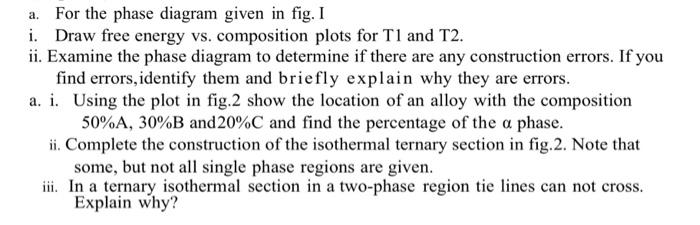
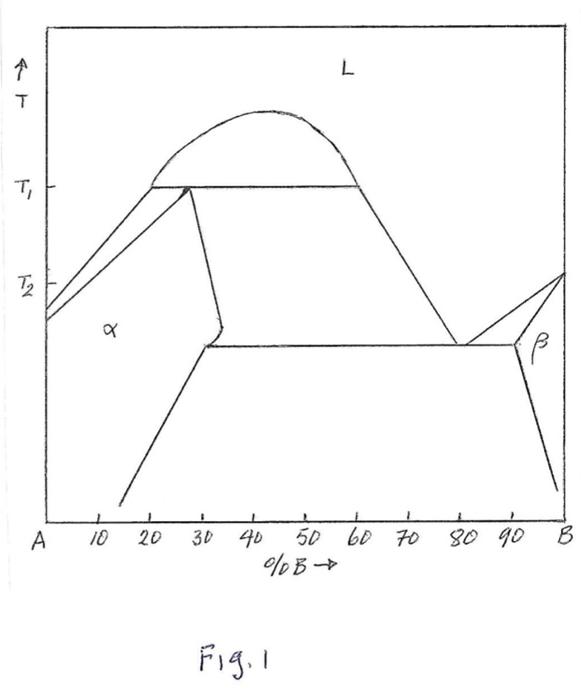
a. For the phase diagram given in fig. I i. Draw free energy vs. composition plots for T1 and T2. ii. Examine the phase diagram to determine if there are any construction errors. If you find errors, identify them and briefly explain why they are errors. a. i. Using the plot in fig. 2 show the location of an alloy with the composition 50%A,30%B and 20%C and find the percentage of the phase. ii. Complete the construction of the isothermal ternary section in fig. 2 . Note that some, but not all single phase regions are given. iii. In a ternary isothermal section in a two-phase region tie lines can not cross. Explain why? Fig.I
Step by Step Solution
There are 3 Steps involved in it
1 Expert Approved Answer
Step: 1 Unlock

Question Has Been Solved by an Expert!
Get step-by-step solutions from verified subject matter experts
Step: 2 Unlock
Step: 3 Unlock