

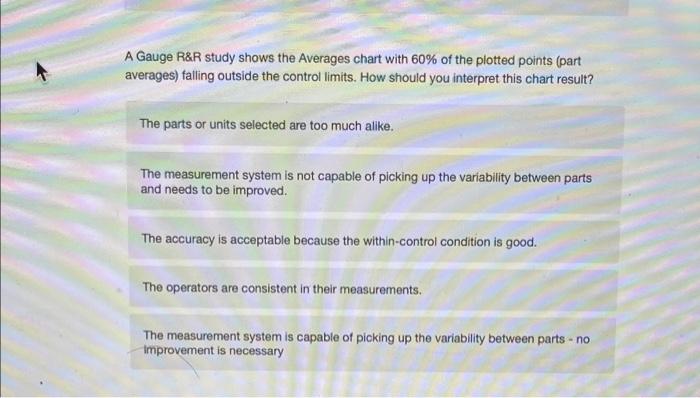
Question: A Gauge R&R study shows the Averages chart with 60% of the plotted points (part averages) falling outside the control limits. How should you interpret
Step by Step Solution
There are 3 Steps involved in it
1 Expert Approved Answer
Step: 1 Unlock

Question Has Been Solved by an Expert!
Get step-by-step solutions from verified subject matter experts
Step: 2 Unlock
Step: 3 Unlock