

Question: a. Generate S curve graphs for five temperatures. The Excel file accompanying this part provides the data (fraction of transformation (y) and time (min) for
a. Generate S curve graphs for five temperatures. The Excel file accompanying this part provides the data (fraction of transformation (y) and time (min) for several temperatures (degrees C)). Use this data to generate S type curves (insert Chart and the chart type should be x, y scatter with smooth lines and markers) for every temperature and produce a figure similar to Figure 10.11 in your text (note the log scale x-axis). Items that need to be included are axes titles with units (% and min), and a key indicating the temperatures for each S curve. The y-axis should be from 0 to 100% and x-axis should be from 1 to 1000 min.
b. Generate a graph of ln(rate) (in min-1) vs 1/T (K-1) with data points for the five temperatures. From the S curves in part (a) determine the time (in min) to achieve 50% transformation and the transformation rate (min-1) for each temperature. Include axes titles with units. Your y-axis should be from 0 to -6 and your x-axis should be from 0.0024 to 0.0028. Add a linear trend line and display the equation and the R2 with your chart.
c. Using the information from part (b) above determine the activation energy for this recrystallization process.
d. By extrapolation, estimate the length of time required for 50% recrystallization at 50 degrees C.
 Data needed for S curves
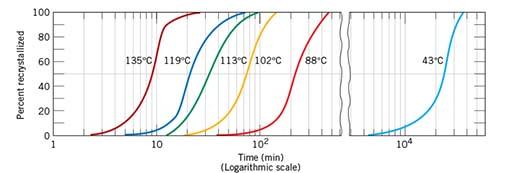
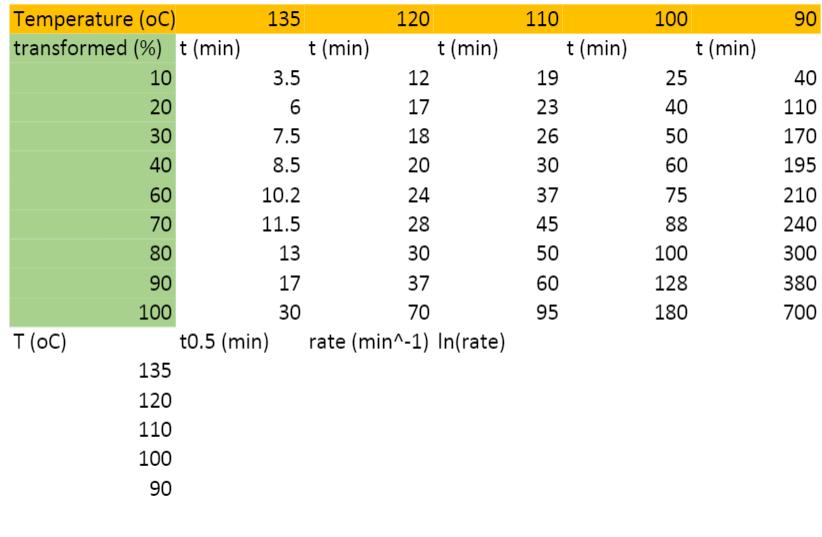
Temperature (oC) transformed (%) t (min) 135 120 110 100 90 t (min) t (min) t (min) t (min) 10 3.5 12 19 25 40 20 6 17 23 40 110 30 7.5 18 26 50 170 40 8.5 20 30 60 195 60 10.2 24 37 75 210 70 11.5 28 45 88 240 80 13 30 50 100 300 90 17 37 60 128 380 100 30 70 95 180 700 T (oC) t0.5 (min) rate (min^-1) In(rate) 135 120 110 100 90
Step by Step Solution
3.49 Rating (166 Votes )
There are 3 Steps involved in it
Temperature oC 136c 120c 110c 100c 90c transformed ... View full answer

Get step-by-step solutions from verified subject matter experts