

Question: a. Given the data in the table below, draw the demand curve in the graph below. Plot all 6 points using the tool provided in
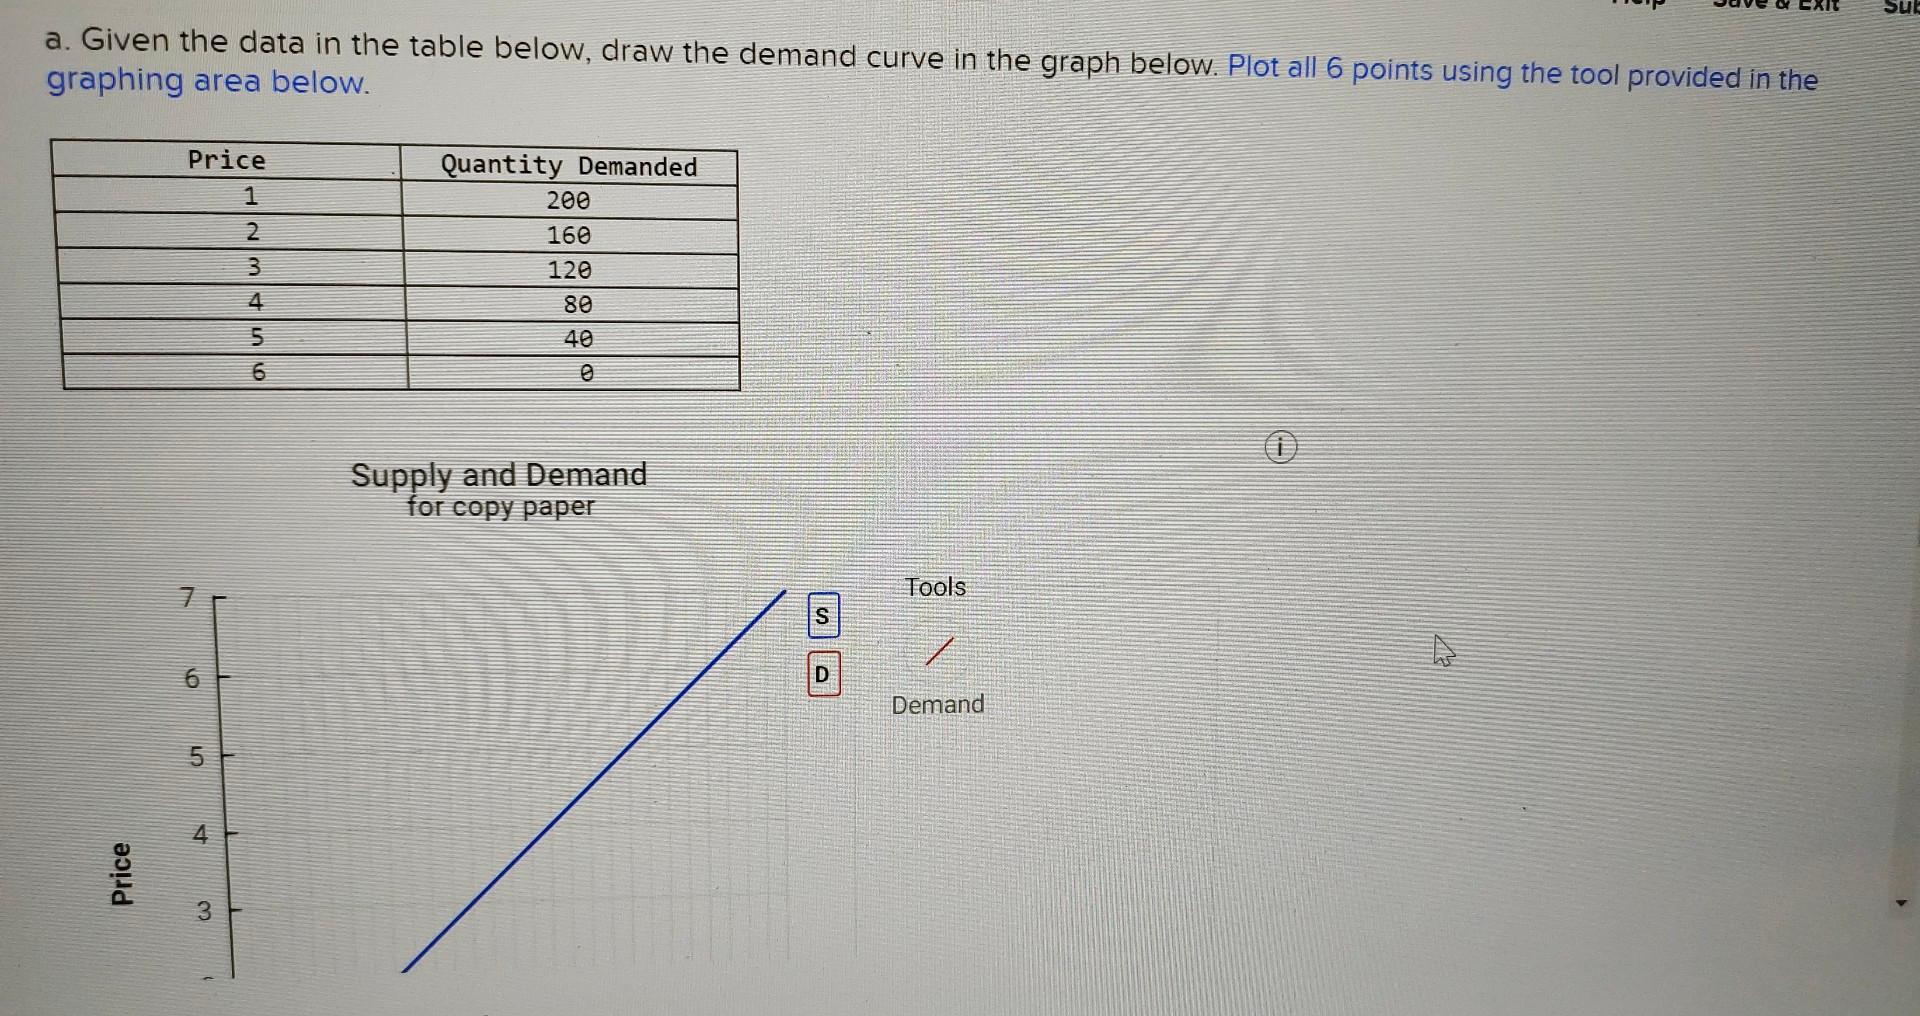
a. Given the data in the table below, draw the demand curve in the graph below. Plot all 6 points using the tool provided in the graphing area below. (1) Price
Step by Step Solution
There are 3 Steps involved in it
1 Expert Approved Answer
Step: 1 Unlock

Question Has Been Solved by an Expert!
Get step-by-step solutions from verified subject matter experts
Step: 2 Unlock
Step: 3 Unlock