

Question: a. Given the data in the table below, draw the demand curve in the graph below. Plot all 6 points using the tool 5 provided
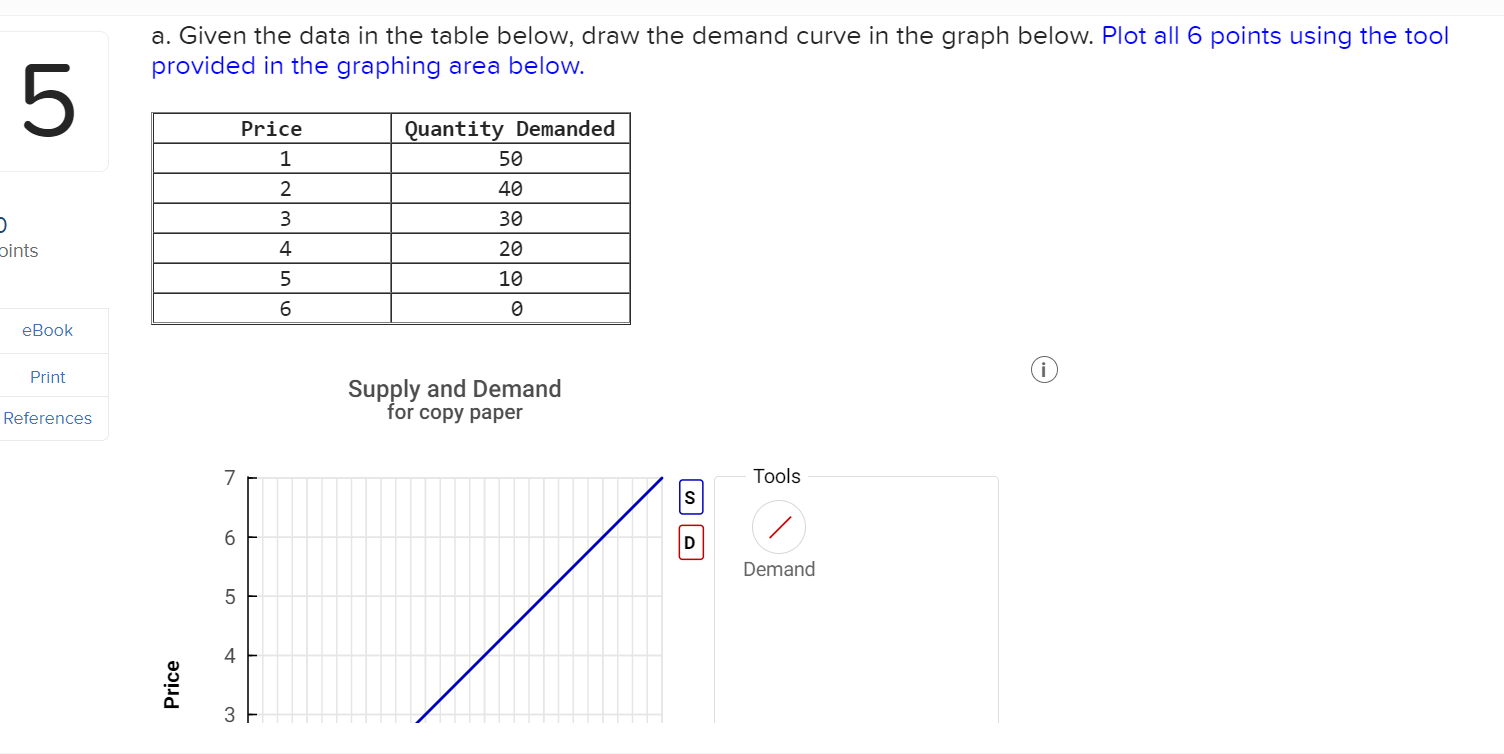
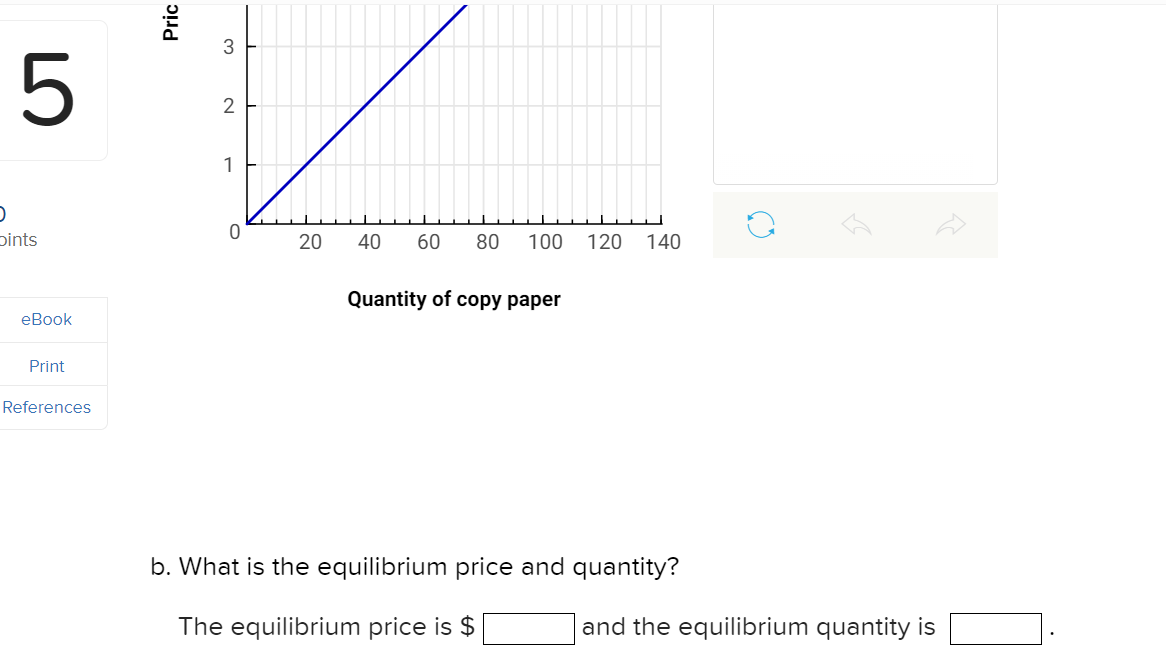
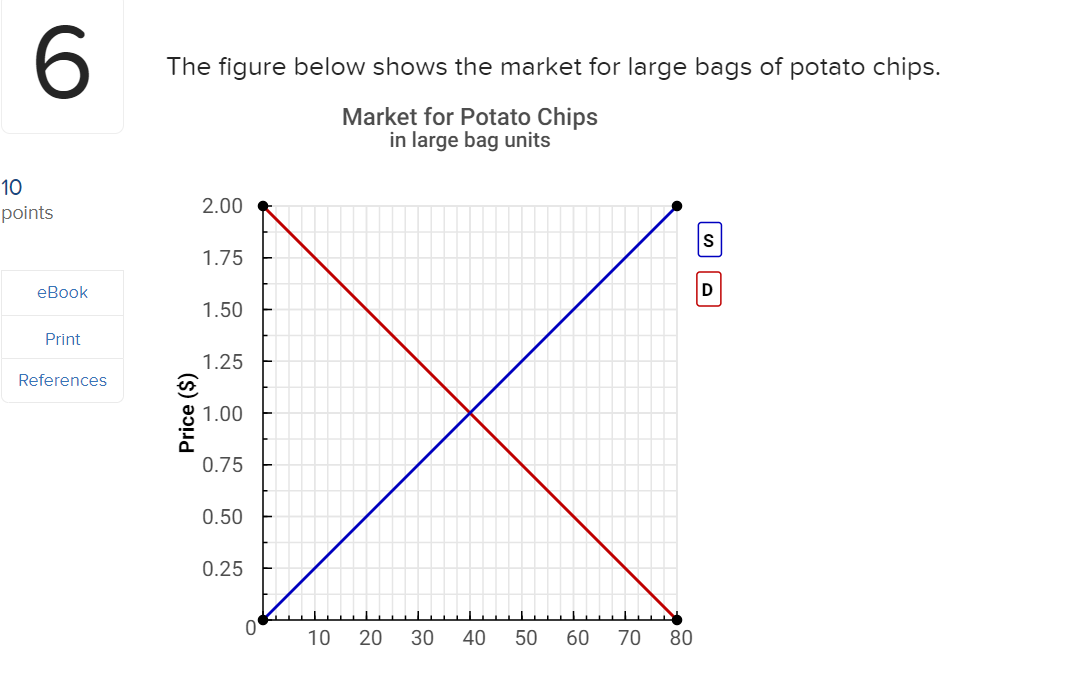
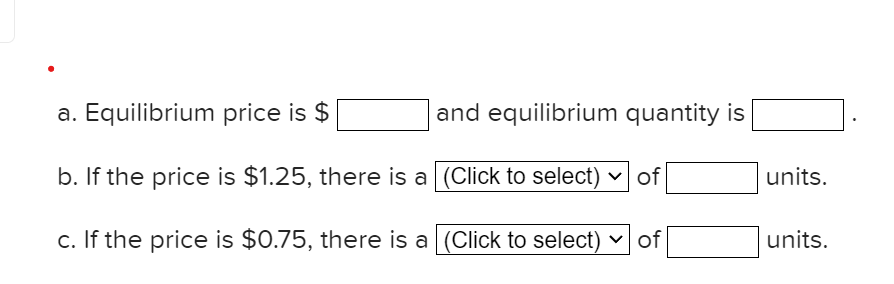
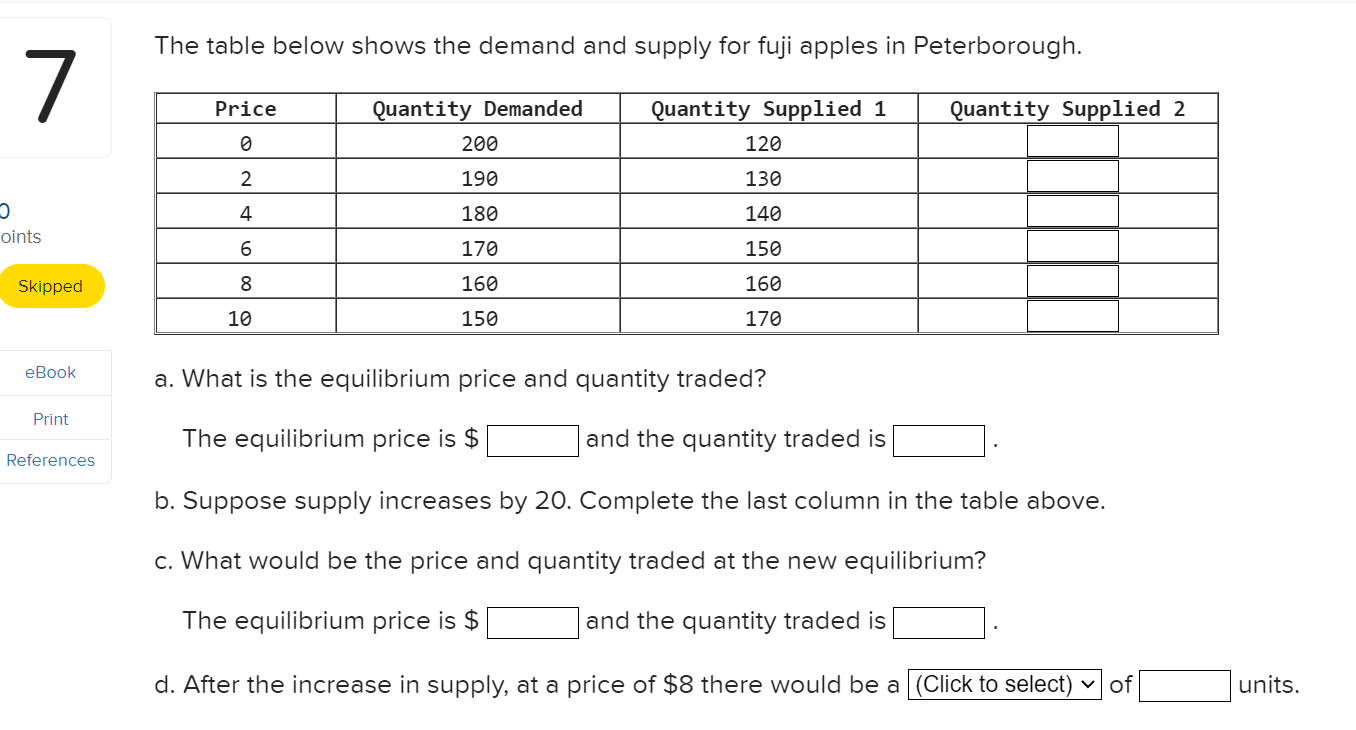
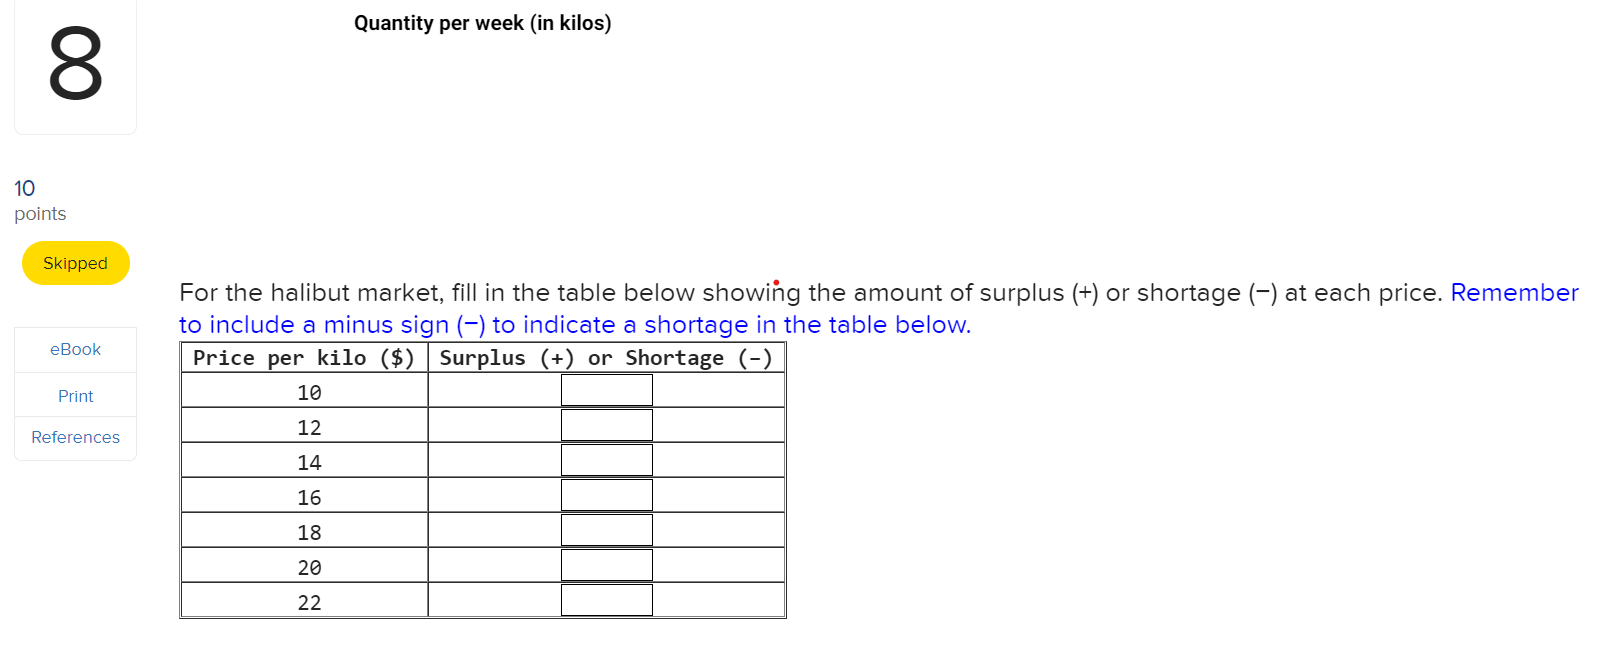
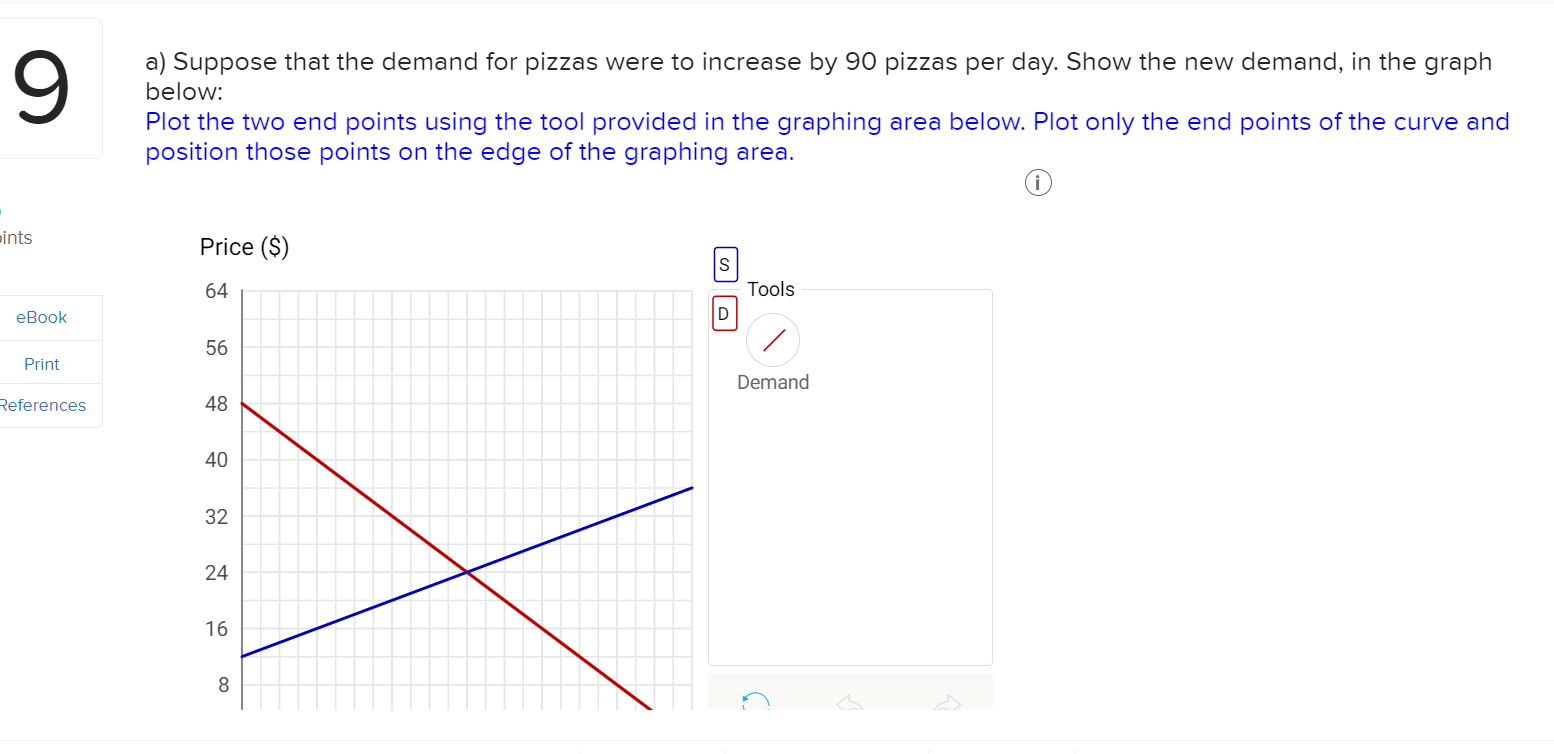
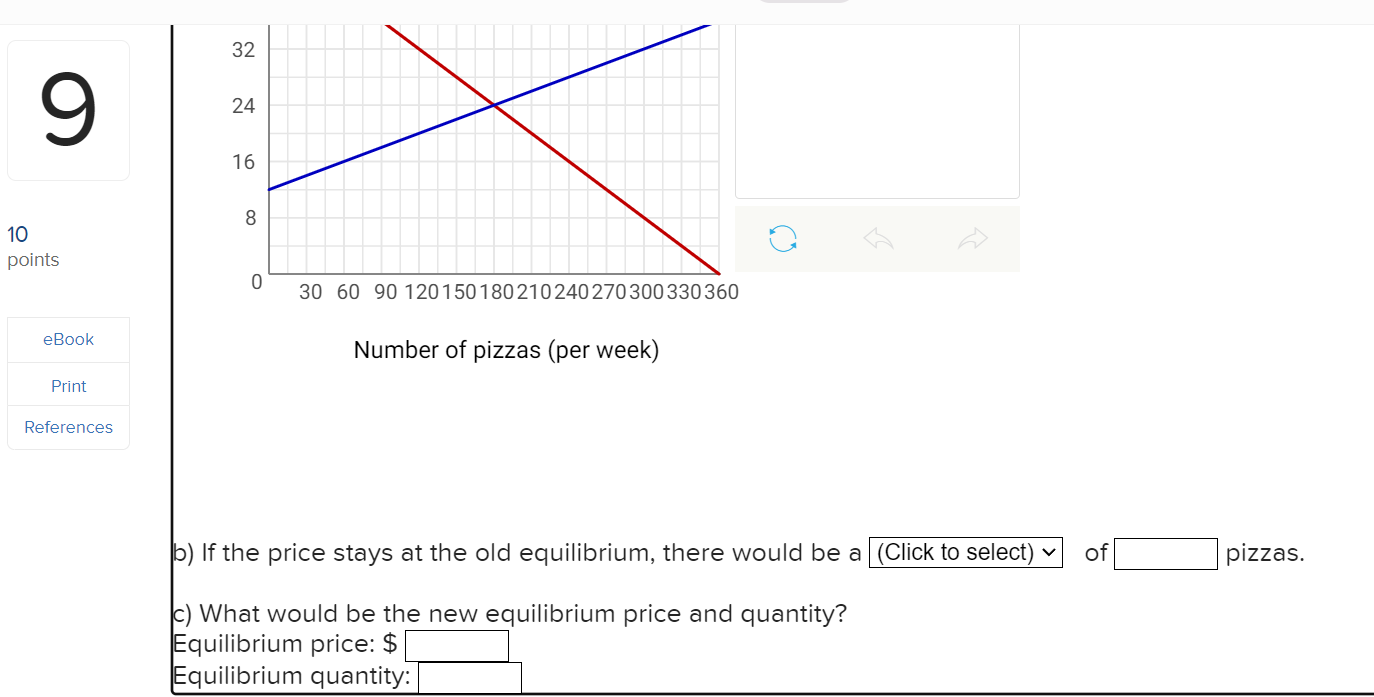
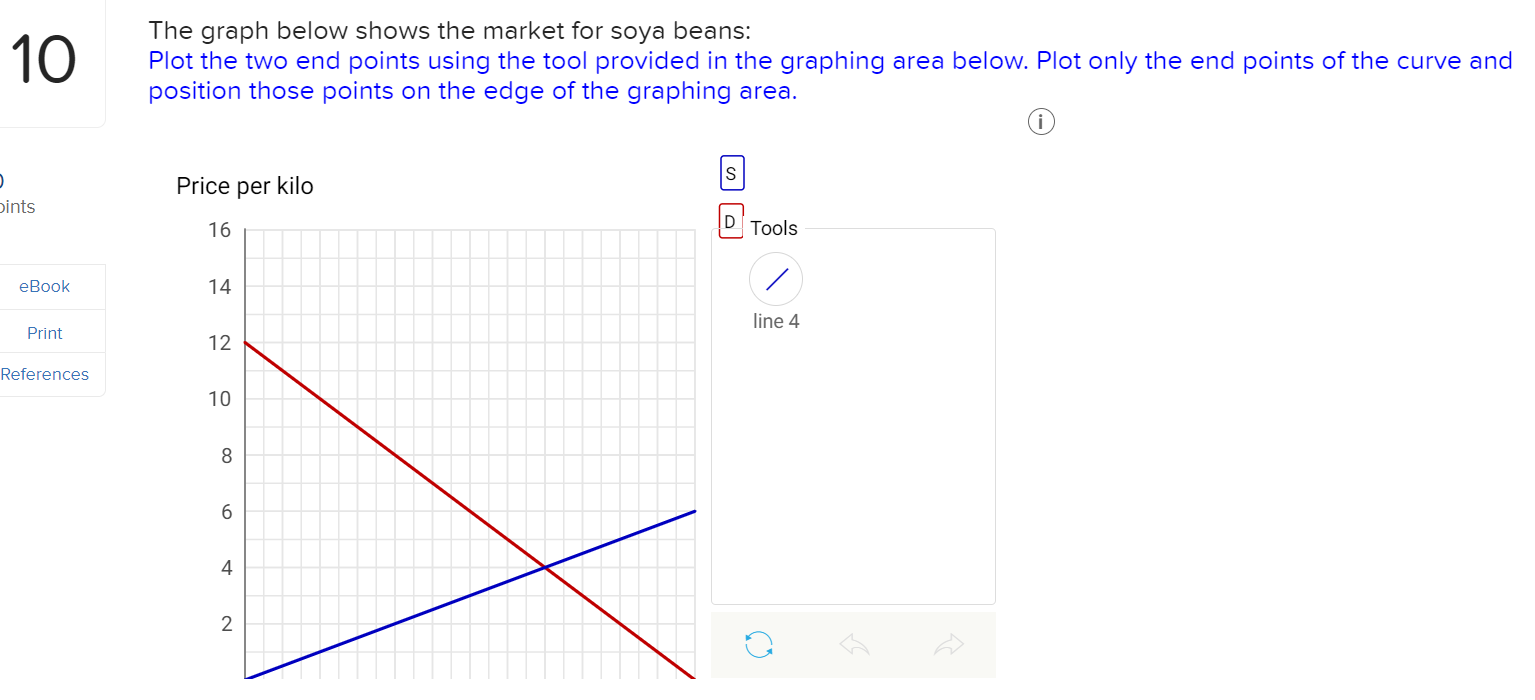
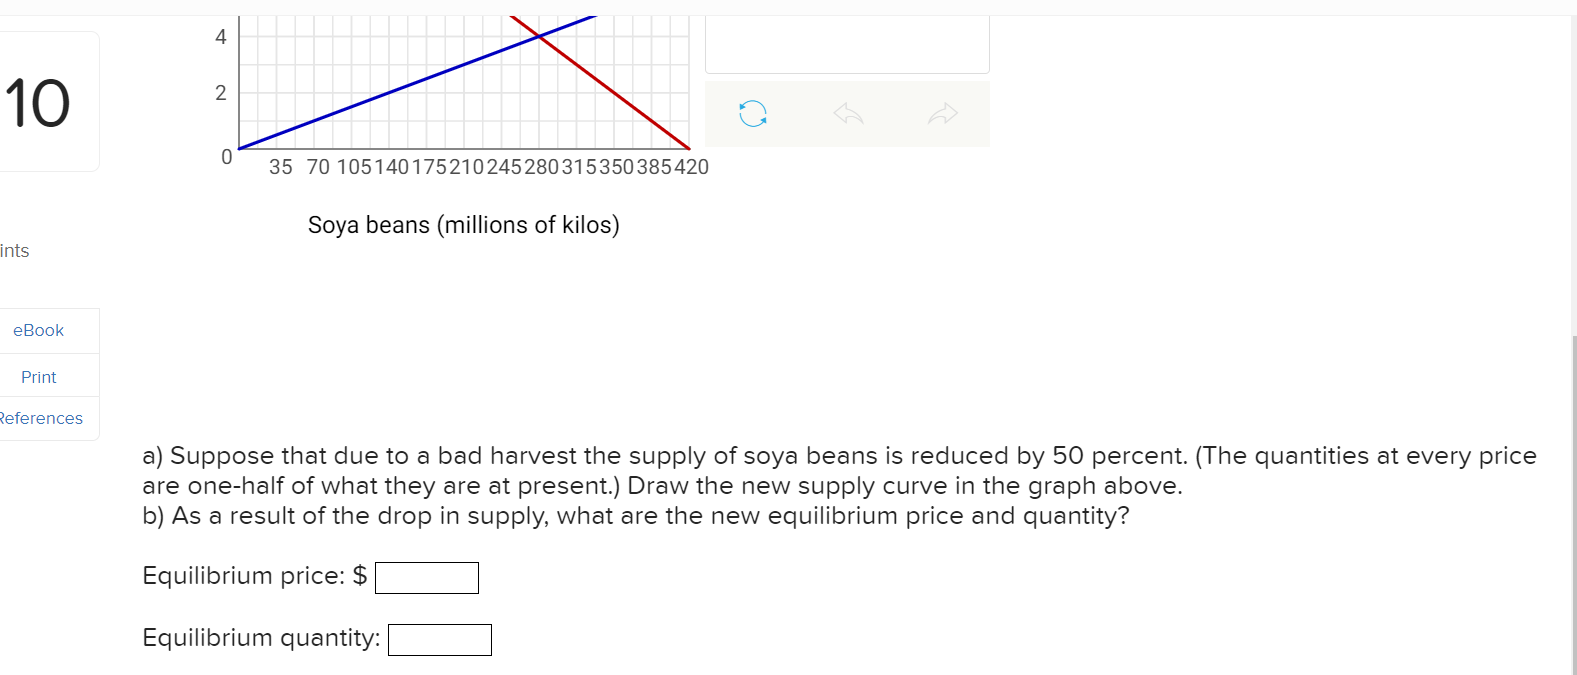
a. Given the data in the table below, draw the demand curve in the graph below. Plot all 6 points using the tool 5 provided in the graphing area below. Quantity Demanded aints eBook Print (:1 Supply and Demand References for copy paper 7 E Tools 6 E / Demand 5 4 Price Pric 3 5 2 7 pints 0 20 40 60 80 100 120 140 Quantity of copy paper eBook Print References b. What is the equilibrium price and quantity? The equilibrium price is $ and the equilibrium quantity is6 The figure below shows the market for large bags of potato chips. Market for Potato Chips in large bag units 10 points 2.00 S 1.75 eBook D 1.50 Print 1.25 References 1.00 0.75 0.50 0.25 0 10 20 30 40 50 60 70 80a. Equilibrium price is $ and equilibrium quantity is b. If the price is $1.25, there is a (Click to select) v of units. c. If the price is $0.75, there is a (Click to select) v of units.The table below shows the demand and supply for fuji apples in Peterborough. Price Quantity Demanded Quantity Supplied 1 Quantity Supplied 2 200 120 2 190 130 4 180 140 oints 6 170 150 Skipped 8 160 160 10 150 170 eBook a. What is the equilibrium price and quantity traded? Print The equilibrium price is $ and the quantity traded is References b. Suppose supply increases by 20. Complete the last column in the table above. c. What would be the price and quantity traded at the new equilibrium? The equilibrium price is $ and the quantity traded is d. After the increase in supply, at a price of $8 there would be a (Click to select) ~ | of units.10 points Skipped eBook Print References Quantity per week (in kilos) For the halibut market, fill in the table below showing the amount of surplus (+) or shortage (-) at each price. Remember to include a minus sign (-) to indicate a shortage in the table below. Price per kilo ($) Surplus (+) or Shortage () 16 12 14 16 18 26 22 9 a) Suppose that the demand for pizzas were to increase by 90 pizzas per day. Show the new demand, in the graph below: Plot the two end points using the tool provided in the graphing area below. Plot only the end points of the curve and position those points on the edge of the graphing area. ints Price ($) 64 Tools eBook D 56 Print Demand References 48 40 32 24 16 832 9 24 16 8 10 points 0 30 60 90 120 150 180210240270 300 330 360 eBook Number of pizzas (per week) Print References b) If the price stays at the old equilibrium, there would be a (Click to select) v of pizzas. c) What would be the new equilibrium price and quantity? Equilibrium price: $ Equilibrium quantity:The graph below shows the market for soya beans: 10 Plot the two end points using the tool provided in the graphing area below. Plot only the end points ofthe curve and position those points on the edge of the graphing area. i Price per kilo ('i'i \\ / )ints 16 E Tools eBook 14 / . line 4 Print 1 2 References 1 0 8 6 4 1O inm eBook Print ?eferences 0 35 70105140175210245280315350385420 Soya beans (millions of kilos) a) Suppose that due to a bad harvest the supply otsoya beans is reduced by 50 percent. (The quantities at every price are one-half of what they are at present.) Draw the new supply curve in the graph above. b) As a result of the drop in supply, what are the new equilibrium price and quantity? Equilibrium price: $ Equilibrium quantity
Step by Step Solution
There are 3 Steps involved in it

Get step-by-step solutions from verified subject matter experts