

Question: a graph c(t)= b/(1 + e -k/(t-a) ). a=b=k=1. draw three different graphs and write a report with it about what happens when you change
a graph c(t)= b/(1 + e-k/(t-a)). a=b=k=1. draw three different graphs and write a report with it about what happens when you change the 'a' value, change the 'b' value and change the 'k' value. Within the reports use the graphs as evidence and explain how the key features are affected from the values changing .
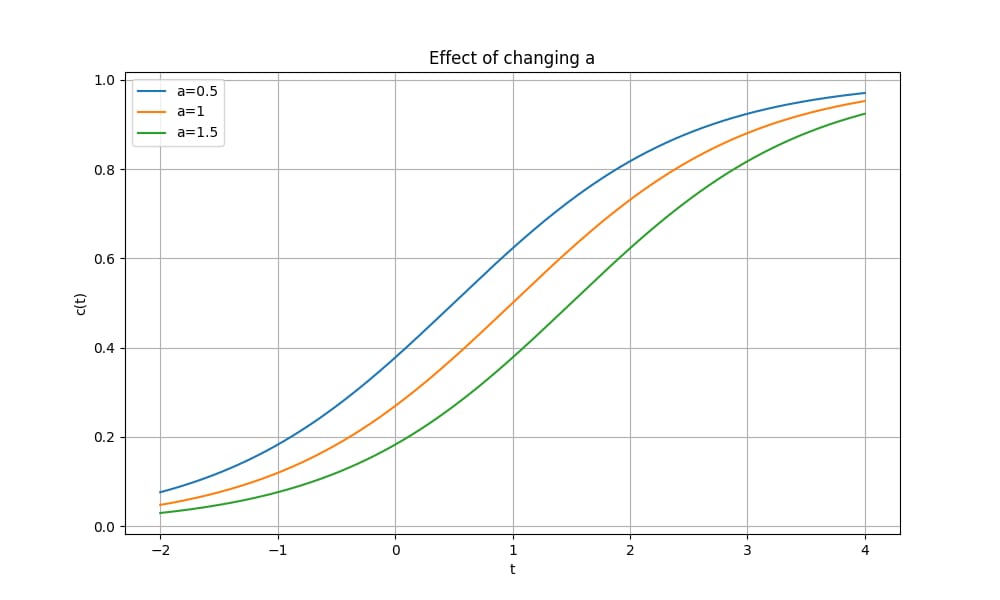
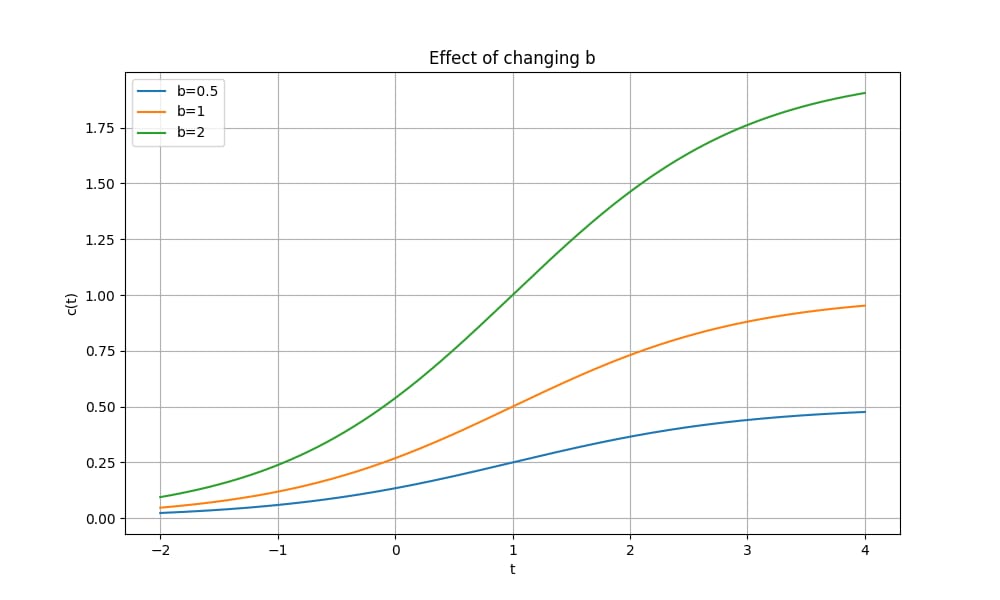
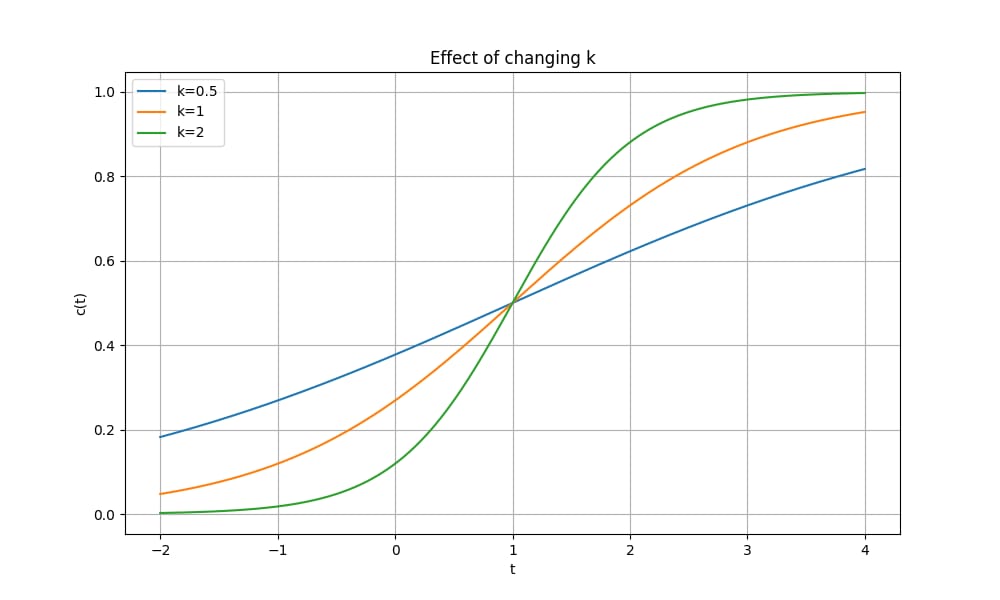
Effect of changing a 1.0 a=0.5 a=1 a=1.5 0.8 0.6 c(t) 0.4 - 0.2 - 0.0 -2 -1 0 N W 4Effect of changing b b=0.5 b=1 1.75 b=2 1.50 1.25 1.00 0.75 0.50 0.25 0.00 -2 0 2 W 4Effect of changing k 1.0 k=0.5 k=1 k=2 0.8 0.6 c(t) 0.4 0.2 - 0.0 -2 0 2 W 4
Step by Step Solution
There are 3 Steps involved in it
1 Expert Approved Answer
Step: 1 Unlock

Question Has Been Solved by an Expert!
Get step-by-step solutions from verified subject matter experts
Step: 2 Unlock
Step: 3 Unlock