

Question: A graph of v(t) is shown for a world-class track sprinter in a 100-m race. (See figure below. For each answer, enter a number.)
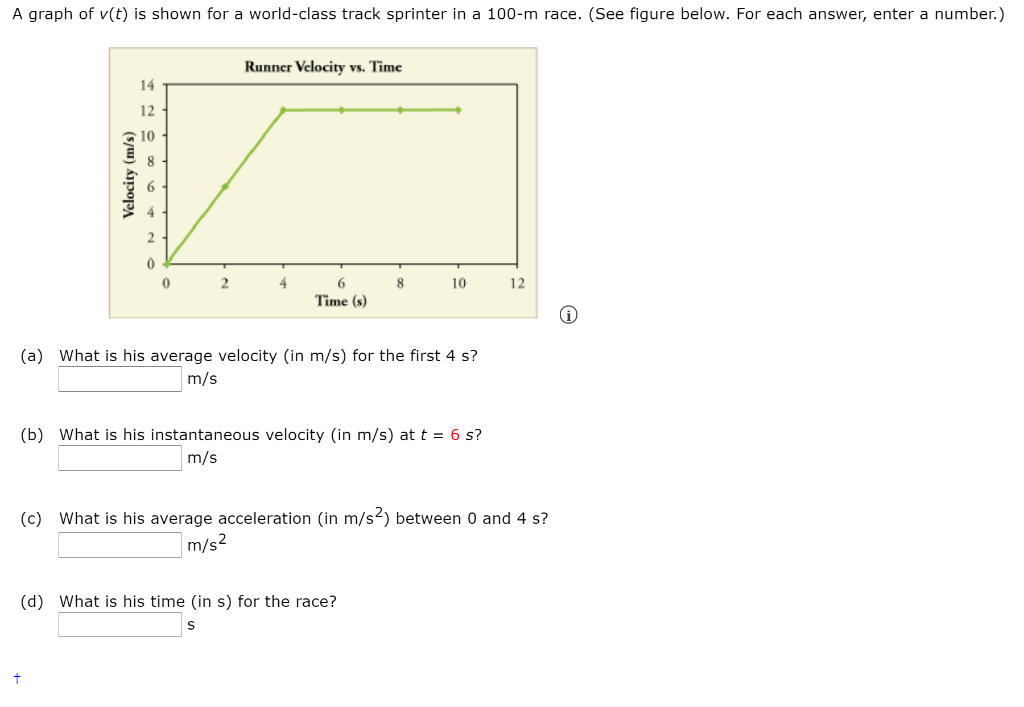
A graph of v(t) is shown for a world-class track sprinter in a 100-m race. (See figure below. For each answer, enter a number.) Velocity (m/s) 14 12 10 0 2 + Runner Velocity vs. Time 4 6 Time (s) 8 (a) What is his average velocity (in m/s) for the first 4 s? m/s 10 (b) What is his instantaneous velocity (in m/s) at t = 6 s? m/s (d) What is his time (in s) for the race? S (c) What is his average acceleration (in m/s) between 0 and 4 s? m/s 12
Step by Step Solution
3.60 Rating (157 Votes )
There are 3 Steps involved in it
a Average velocity for constant Acceleration is given by Vav d 2 where From graph we have ... View full answer

Get step-by-step solutions from verified subject matter experts