

Question: A graphical representation of a line ar program is shown below. The shaded area represents the feasible region, and the dashed line in the middle
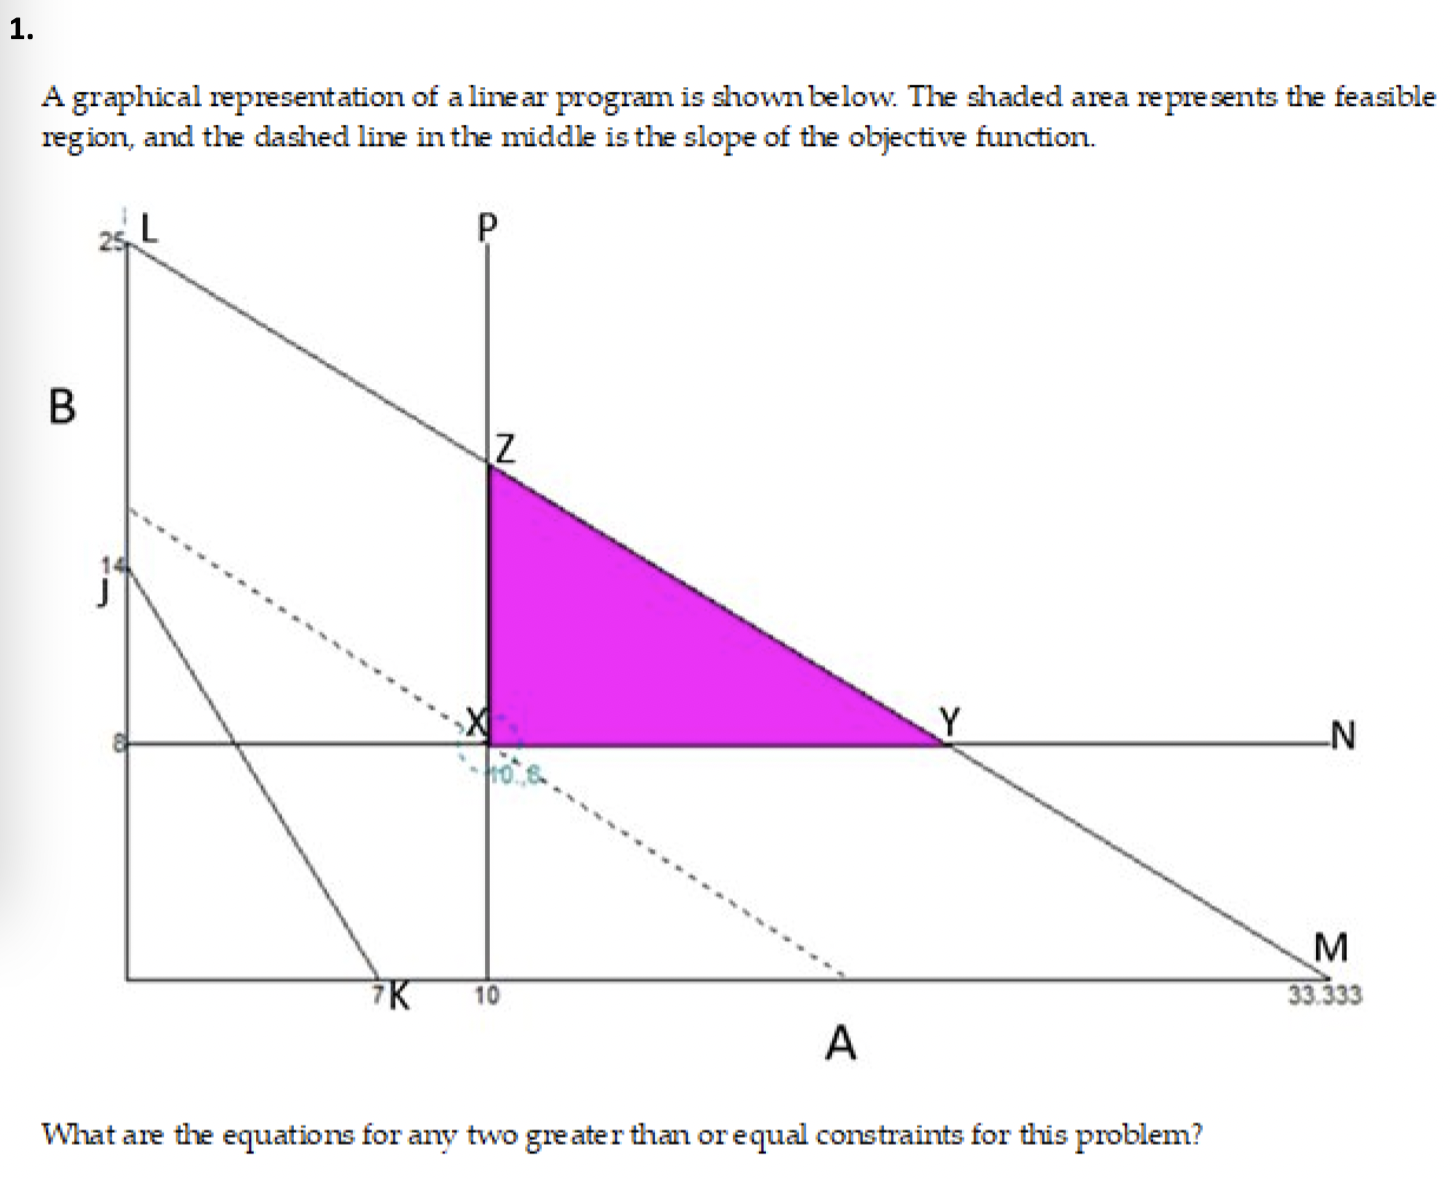
A graphical representation of a line ar program is shown below. The shaded area represents the feasible region, and the dashed line in the middle is the slope of the objective function.
What are the equations for any two gre ater than or equal constraints for this problem?
Step by Step Solution
There are 3 Steps involved in it
1 Expert Approved Answer
Step: 1 Unlock

Question Has Been Solved by an Expert!
Get step-by-step solutions from verified subject matter experts
Step: 2 Unlock
Step: 3 Unlock