

Question: A graphical representation of a linear program is shown below. The shaded area represents the feasible region, and the dashed line in the middle is
A graphical representation of a linear program is shown below. The shaded area represents the feasible region, and the dashed line in the middle is the slope of the objective function.
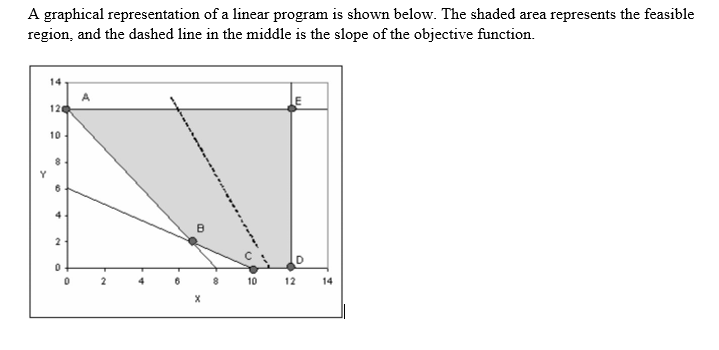
If this is a minimization (in the figure above), which extreme point is the optimal solution?
A) Point A
B) Point B
C) Point C
D) None of the above
A graphical representation of a linear program is shown below. The shaded area represents the feasible region, and the dashed line in the middle is the slope of the objective function
Step by Step Solution
There are 3 Steps involved in it
1 Expert Approved Answer
Step: 1 Unlock

Question Has Been Solved by an Expert!
Get step-by-step solutions from verified subject matter experts
Step: 2 Unlock
Step: 3 Unlock