

Question: A graphical representation of a linear program is shown below. The shaded area represents the feasible region, and the dashed line in the middle is
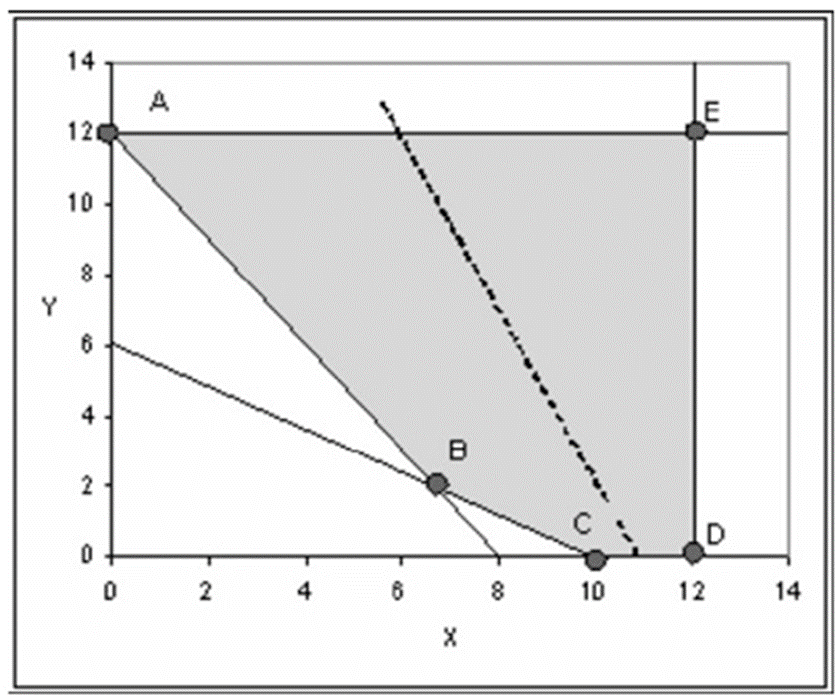
A graphical representation of a linear program is shown below. The shaded area represents the feasible region, and the dashed line in the middle is the slope of the objective function.
14 A 120 E 10 8 Y 6 4 C D 2 4 8 10 12 14 X
Step by Step Solution
There are 3 Steps involved in it
1 Expert Approved Answer
Step: 1 Unlock

Question Has Been Solved by an Expert!
Get step-by-step solutions from verified subject matter experts
Step: 2 Unlock
Step: 3 Unlock