

Question: A linear model for the data in the table is shown in the scatter plot x LY 1 1 12 3 19 5 6 68
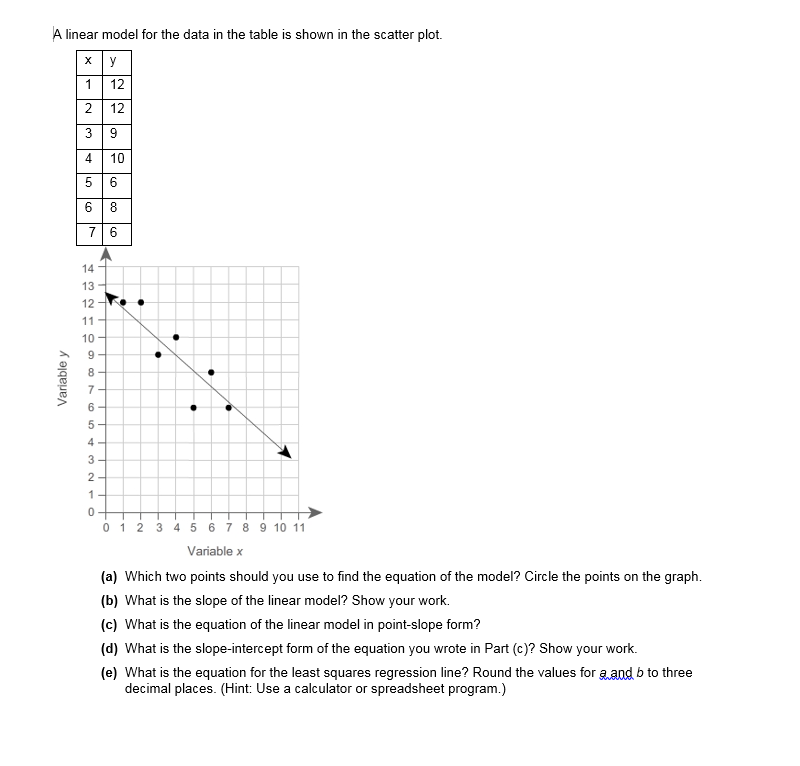
A linear model for the data in the table is shown in the scatter plot x LY 1 1 12 3 19 5 6 68 8 9 10 11 Variable x ( a ) Which two points should you use to find the equation of the model ? Circle the points on the graph ( 6 ) What is the slope of the linear model ? Show your work . ( c ) What is the equation of the linear model in point - slope form ? ( d ) What is the slope intercept form of the equation you wrote in Part ( C ) ? Show your work e ) What is the equation for the least squares regression line ? Round the values for a and b to three decimal places . ( Hint : Use a calculator or spreadsheet program )
Step by Step Solution
There are 3 Steps involved in it
1 Expert Approved Answer
Step: 1 Unlock

Question Has Been Solved by an Expert!
Get step-by-step solutions from verified subject matter experts
Step: 2 Unlock
Step: 3 Unlock