

A local supermarket in Tingley introduced a loyalty card app in January 2022. Customers buy groceries...
Fantastic news! We've Found the answer you've been seeking!
Question:
Transcribed Image Text:
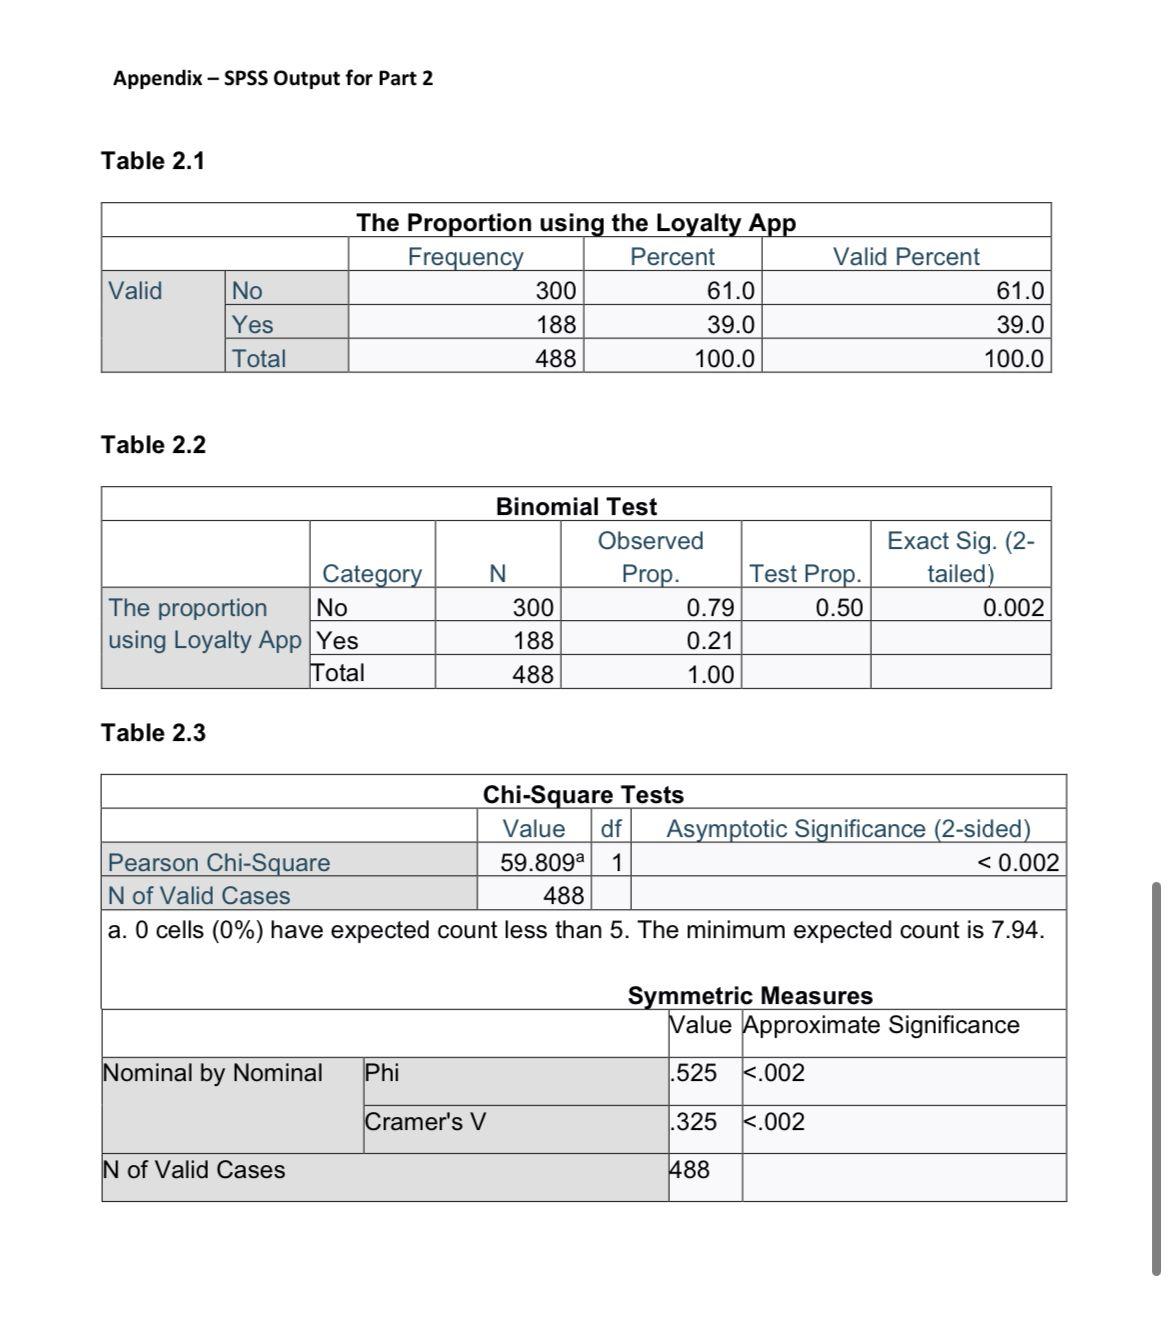
A local supermarket in Tingley introduced a loyalty card app in January 2022. Customers buy groceries using the loyalty card app on their mobile phones. As a consultant to the local supermarket, you have been asked to conduct a study to examine the frequency of repeat purchases by customers. Specifically, you have been asked to assess whether there is a disparity in repeat purchases between consumers who use the loyalty card app and those who are not The following research questions were set. 1. Is the proportion of consumers who use the loyalty card app greater than 50%? 2. Is the proportion of consumers who make repeat purchases different between those who use the loyalty app and those who do not? The following two sets of hypotheses were stated. Null: Alternative: Null: Alternative: The proportion of consumers who use the loyalty app is equal to 50%. The proportion of consumers who use the loyalty app is greater than 50%. The proportion of consumers who make repeat purchases is not different between those who use the loyalty app and those who do not. The proportion of consumers who make repeat purchases is different between those who those who use the loyalty app and those who do not. A simple random survey was conducted among traditional supermarket shoppers. Two of the questions, taken from the research instrument, are reproduced below. Question 1: Do you make repeat purchases? Question 2: Do you use the loyalty app? 0. No 0. No 1. Yes 1. Yes Appendix - SPSS Output for Part 2 Required for Part 2 (comments for Part 2 should not exceed 400 words in total) To complete the following, you need to refer to the output in the Appendix below. The SPSS tables should be inserted into your report and used as statistical evidence. Use either a snipping tool to copy the tables in the appendix or copy the tables (saved as PNG images) from the file: 'SPSS Evidence' in the coursework folder. The tables are made available but a data set is NOT made available for Part 2. Tables can be found in the Appendix. Interpret Table 2.1 and prepare a short comment on your findings. Table 2.2 shows the output for a hypothesis test conducted to inform on research question 1 above. Interpret the output and prepare a short statistical report, in the classical style, to summarise your findings. In your report, you need to state the null and alternative hypotheses, name the hypothesis test conducted and fully explain the output (all relevant values), calculate and interpret the effect size, where relevant, and discuss the assumptions of the test. a. b. C. Based on your statistical interpretation, write a second comment aimed at the client to explain the outcome of the research in plain English. Table 2.3 shows the output for a hypothesis test conducted to inform on research question 2 above. Interpret the output and prepare a short statistical report, in the classical style, to summarise your findings. In your report, you need to state the null and alternative hypotheses, name the hypothesis test conducted and fully explain the output (all relevant values), calculate and interpret the effect size, where relevant, and discuss the assumptions. Based on your statistical interpretation, write a second comment aimed at the client to explain the outcome of the research in plain English. NB: Up to 10% of the marks is awarded for coursework management. Marks are awarded for professional presentation, use of section and paragraph titles and starting each task on a new page, among others. Appendix - SPSS Output for Part 2 Table 2.1 Valid Table 2.2 No Yes Total Table 2.3 The proportion No using Loyalty App Yes Total The Proportion using the Loyalty App Frequency Percent Category Nominal by Nominal N of Valid Cases Phi 300 188 488 Binomial Test N Cramer's V 300 188 488 61.0 39.0 100.0 Observed Prop. 0.79 0.21 1.00 Valid Percent Test Prop. 0.50 Pearson Chi-Square N of Valid Cases 488 a. 0 cells (0%) have expected count less than 5. The minimum expected count is 7.94. 61.0 39.0 100.0 Exact Sig. (2- tailed) Chi-Square Tests Value df Asymptotic Significance (2-sided) < 0.002 59.809a 1 Symmetric Measures 0.002 Value Approximate Significance 525 <.002 325 .002 488 A local supermarket in Tingley introduced a loyalty card app in January 2022. Customers buy groceries using the loyalty card app on their mobile phones. As a consultant to the local supermarket, you have been asked to conduct a study to examine the frequency of repeat purchases by customers. Specifically, you have been asked to assess whether there is a disparity in repeat purchases between consumers who use the loyalty card app and those who are not The following research questions were set. 1. Is the proportion of consumers who use the loyalty card app greater than 50%? 2. Is the proportion of consumers who make repeat purchases different between those who use the loyalty app and those who do not? The following two sets of hypotheses were stated. Null: Alternative: Null: Alternative: The proportion of consumers who use the loyalty app is equal to 50%. The proportion of consumers who use the loyalty app is greater than 50%. The proportion of consumers who make repeat purchases is not different between those who use the loyalty app and those who do not. The proportion of consumers who make repeat purchases is different between those who those who use the loyalty app and those who do not. A simple random survey was conducted among traditional supermarket shoppers. Two of the questions, taken from the research instrument, are reproduced below. Question 1: Do you make repeat purchases? Question 2: Do you use the loyalty app? 0. No 0. No 1. Yes 1. Yes Appendix - SPSS Output for Part 2 Required for Part 2 (comments for Part 2 should not exceed 400 words in total) To complete the following, you need to refer to the output in the Appendix below. The SPSS tables should be inserted into your report and used as statistical evidence. Use either a snipping tool to copy the tables in the appendix or copy the tables (saved as PNG images) from the file: 'SPSS Evidence' in the coursework folder. The tables are made available but a data set is NOT made available for Part 2. Tables can be found in the Appendix. Interpret Table 2.1 and prepare a short comment on your findings. Table 2.2 shows the output for a hypothesis test conducted to inform on research question 1 above. Interpret the output and prepare a short statistical report, in the classical style, to summarise your findings. In your report, you need to state the null and alternative hypotheses, name the hypothesis test conducted and fully explain the output (all relevant values), calculate and interpret the effect size, where relevant, and discuss the assumptions of the test. a. b. C. Based on your statistical interpretation, write a second comment aimed at the client to explain the outcome of the research in plain English. Table 2.3 shows the output for a hypothesis test conducted to inform on research question 2 above. Interpret the output and prepare a short statistical report, in the classical style, to summarise your findings. In your report, you need to state the null and alternative hypotheses, name the hypothesis test conducted and fully explain the output (all relevant values), calculate and interpret the effect size, where relevant, and discuss the assumptions. Based on your statistical interpretation, write a second comment aimed at the client to explain the outcome of the research in plain English. NB: Up to 10% of the marks is awarded for coursework management. Marks are awarded for professional presentation, use of section and paragraph titles and starting each task on a new page, among others. Appendix - SPSS Output for Part 2 Table 2.1 Valid Table 2.2 No Yes Total Table 2.3 The proportion No using Loyalty App Yes Total The Proportion using the Loyalty App Frequency Percent Category Nominal by Nominal N of Valid Cases Phi 300 188 488 Binomial Test N Cramer's V 300 188 488 61.0 39.0 100.0 Observed Prop. 0.79 0.21 1.00 Valid Percent Test Prop. 0.50 Pearson Chi-Square N of Valid Cases 488 a. 0 cells (0%) have expected count less than 5. The minimum expected count is 7.94. 61.0 39.0 100.0 Exact Sig. (2- tailed) Chi-Square Tests Value df Asymptotic Significance (2-sided) < 0.002 59.809a 1 Symmetric Measures 0.002 Value Approximate Significance 525 <.002 325 .002 488 A local supermarket in Tingley introduced a loyalty card app in January 2022. Customers buy groceries using the loyalty card app on their mobile phones. As a consultant to the local supermarket, you have been asked to conduct a study to examine the frequency of repeat purchases by customers. Specifically, you have been asked to assess whether there is a disparity in repeat purchases between consumers who use the loyalty card app and those who are not The following research questions were set. 1. Is the proportion of consumers who use the loyalty card app greater than 50%? 2. Is the proportion of consumers who make repeat purchases different between those who use the loyalty app and those who do not? The following two sets of hypotheses were stated. Null: Alternative: Null: Alternative: The proportion of consumers who use the loyalty app is equal to 50%. The proportion of consumers who use the loyalty app is greater than 50%. The proportion of consumers who make repeat purchases is not different between those who use the loyalty app and those who do not. The proportion of consumers who make repeat purchases is different between those who those who use the loyalty app and those who do not. A simple random survey was conducted among traditional supermarket shoppers. Two of the questions, taken from the research instrument, are reproduced below. Question 1: Do you make repeat purchases? Question 2: Do you use the loyalty app? 0. No 0. No 1. Yes 1. Yes Appendix - SPSS Output for Part 2 Required for Part 2 (comments for Part 2 should not exceed 400 words in total) To complete the following, you need to refer to the output in the Appendix below. The SPSS tables should be inserted into your report and used as statistical evidence. Use either a snipping tool to copy the tables in the appendix or copy the tables (saved as PNG images) from the file: 'SPSS Evidence' in the coursework folder. The tables are made available but a data set is NOT made available for Part 2. Tables can be found in the Appendix. Interpret Table 2.1 and prepare a short comment on your findings. Table 2.2 shows the output for a hypothesis test conducted to inform on research question 1 above. Interpret the output and prepare a short statistical report, in the classical style, to summarise your findings. In your report, you need to state the null and alternative hypotheses, name the hypothesis test conducted and fully explain the output (all relevant values), calculate and interpret the effect size, where relevant, and discuss the assumptions of the test. a. b. C. Based on your statistical interpretation, write a second comment aimed at the client to explain the outcome of the research in plain English. Table 2.3 shows the output for a hypothesis test conducted to inform on research question 2 above. Interpret the output and prepare a short statistical report, in the classical style, to summarise your findings. In your report, you need to state the null and alternative hypotheses, name the hypothesis test conducted and fully explain the output (all relevant values), calculate and interpret the effect size, where relevant, and discuss the assumptions. Based on your statistical interpretation, write a second comment aimed at the client to explain the outcome of the research in plain English. NB: Up to 10% of the marks is awarded for coursework management. Marks are awarded for professional presentation, use of section and paragraph titles and starting each task on a new page, among others. Appendix - SPSS Output for Part 2 Table 2.1 Valid Table 2.2 No Yes Total Table 2.3 The proportion No using Loyalty App Yes Total The Proportion using the Loyalty App Frequency Percent Category Nominal by Nominal N of Valid Cases Phi 300 188 488 Binomial Test N Cramer's V 300 188 488 61.0 39.0 100.0 Observed Prop. 0.79 0.21 1.00 Valid Percent Test Prop. 0.50 Pearson Chi-Square N of Valid Cases 488 a. 0 cells (0%) have expected count less than 5. The minimum expected count is 7.94. 61.0 39.0 100.0 Exact Sig. (2- tailed) Chi-Square Tests Value df Asymptotic Significance (2-sided) < 0.002 59.809a 1 Symmetric Measures 0.002 Value Approximate Significance 525 <.002 325 .002 488 A local supermarket in Tingley introduced a loyalty card app in January 2022. Customers buy groceries using the loyalty card app on their mobile phones. As a consultant to the local supermarket, you have been asked to conduct a study to examine the frequency of repeat purchases by customers. Specifically, you have been asked to assess whether there is a disparity in repeat purchases between consumers who use the loyalty card app and those who are not The following research questions were set. 1. Is the proportion of consumers who use the loyalty card app greater than 50%? 2. Is the proportion of consumers who make repeat purchases different between those who use the loyalty app and those who do not? The following two sets of hypotheses were stated. Null: Alternative: Null: Alternative: The proportion of consumers who use the loyalty app is equal to 50%. The proportion of consumers who use the loyalty app is greater than 50%. The proportion of consumers who make repeat purchases is not different between those who use the loyalty app and those who do not. The proportion of consumers who make repeat purchases is different between those who those who use the loyalty app and those who do not. A simple random survey was conducted among traditional supermarket shoppers. Two of the questions, taken from the research instrument, are reproduced below. Question 1: Do you make repeat purchases? Question 2: Do you use the loyalty app? 0. No 0. No 1. Yes 1. Yes Appendix - SPSS Output for Part 2 Required for Part 2 (comments for Part 2 should not exceed 400 words in total) To complete the following, you need to refer to the output in the Appendix below. The SPSS tables should be inserted into your report and used as statistical evidence. Use either a snipping tool to copy the tables in the appendix or copy the tables (saved as PNG images) from the file: 'SPSS Evidence' in the coursework folder. The tables are made available but a data set is NOT made available for Part 2. Tables can be found in the Appendix. Interpret Table 2.1 and prepare a short comment on your findings. Table 2.2 shows the output for a hypothesis test conducted to inform on research question 1 above. Interpret the output and prepare a short statistical report, in the classical style, to summarise your findings. In your report, you need to state the null and alternative hypotheses, name the hypothesis test conducted and fully explain the output (all relevant values), calculate and interpret the effect size, where relevant, and discuss the assumptions of the test. a. b. C. Based on your statistical interpretation, write a second comment aimed at the client to explain the outcome of the research in plain English. Table 2.3 shows the output for a hypothesis test conducted to inform on research question 2 above. Interpret the output and prepare a short statistical report, in the classical style, to summarise your findings. In your report, you need to state the null and alternative hypotheses, name the hypothesis test conducted and fully explain the output (all relevant values), calculate and interpret the effect size, where relevant, and discuss the assumptions. Based on your statistical interpretation, write a second comment aimed at the client to explain the outcome of the research in plain English. NB: Up to 10% of the marks is awarded for coursework management. Marks are awarded for professional presentation, use of section and paragraph titles and starting each task on a new page, among others. Appendix - SPSS Output for Part 2 Table 2.1 Valid Table 2.2 No Yes Total Table 2.3 The proportion No using Loyalty App Yes Total The Proportion using the Loyalty App Frequency Percent Category Nominal by Nominal N of Valid Cases Phi 300 188 488 Binomial Test N Cramer's V 300 188 488 61.0 39.0 100.0 Observed Prop. 0.79 0.21 1.00 Valid Percent Test Prop. 0.50 Pearson Chi-Square N of Valid Cases 488 a. 0 cells (0%) have expected count less than 5. The minimum expected count is 7.94. 61.0 39.0 100.0 Exact Sig. (2- tailed) Chi-Square Tests Value df Asymptotic Significance (2-sided) < 0.002 59.809a 1 Symmetric Measures 0.002 Value Approximate Significance 525 <.002 325 .002 488 A local supermarket in Tingley introduced a loyalty card app in January 2022. Customers buy groceries using the loyalty card app on their mobile phones. As a consultant to the local supermarket, you have been asked to conduct a study to examine the frequency of repeat purchases by customers. Specifically, you have been asked to assess whether there is a disparity in repeat purchases between consumers who use the loyalty card app and those who are not The following research questions were set. 1. Is the proportion of consumers who use the loyalty card app greater than 50%? 2. Is the proportion of consumers who make repeat purchases different between those who use the loyalty app and those who do not? The following two sets of hypotheses were stated. Null: Alternative: Null: Alternative: The proportion of consumers who use the loyalty app is equal to 50%. The proportion of consumers who use the loyalty app is greater than 50%. The proportion of consumers who make repeat purchases is not different between those who use the loyalty app and those who do not. The proportion of consumers who make repeat purchases is different between those who those who use the loyalty app and those who do not. A simple random survey was conducted among traditional supermarket shoppers. Two of the questions, taken from the research instrument, are reproduced below. Question 1: Do you make repeat purchases? Question 2: Do you use the loyalty app? 0. No 0. No 1. Yes 1. Yes Appendix - SPSS Output for Part 2 Required for Part 2 (comments for Part 2 should not exceed 400 words in total) To complete the following, you need to refer to the output in the Appendix below. The SPSS tables should be inserted into your report and used as statistical evidence. Use either a snipping tool to copy the tables in the appendix or copy the tables (saved as PNG images) from the file: 'SPSS Evidence' in the coursework folder. The tables are made available but a data set is NOT made available for Part 2. Tables can be found in the Appendix. Interpret Table 2.1 and prepare a short comment on your findings. Table 2.2 shows the output for a hypothesis test conducted to inform on research question 1 above. Interpret the output and prepare a short statistical report, in the classical style, to summarise your findings. In your report, you need to state the null and alternative hypotheses, name the hypothesis test conducted and fully explain the output (all relevant values), calculate and interpret the effect size, where relevant, and discuss the assumptions of the test. a. b. C. Based on your statistical interpretation, write a second comment aimed at the client to explain the outcome of the research in plain English. Table 2.3 shows the output for a hypothesis test conducted to inform on research question 2 above. Interpret the output and prepare a short statistical report, in the classical style, to summarise your findings. In your report, you need to state the null and alternative hypotheses, name the hypothesis test conducted and fully explain the output (all relevant values), calculate and interpret the effect size, where relevant, and discuss the assumptions. Based on your statistical interpretation, write a second comment aimed at the client to explain the outcome of the research in plain English. NB: Up to 10% of the marks is awarded for coursework management. Marks are awarded for professional presentation, use of section and paragraph titles and starting each task on a new page, among others. Appendix - SPSS Output for Part 2 Table 2.1 Valid Table 2.2 No Yes Total Table 2.3 The proportion No using Loyalty App Yes Total The Proportion using the Loyalty App Frequency Percent Category Nominal by Nominal N of Valid Cases Phi 300 188 488 Binomial Test N Cramer's V 300 188 488 61.0 39.0 100.0 Observed Prop. 0.79 0.21 1.00 Valid Percent Test Prop. 0.50 Pearson Chi-Square N of Valid Cases 488 a. 0 cells (0%) have expected count less than 5. The minimum expected count is 7.94. 61.0 39.0 100.0 Exact Sig. (2- tailed) Chi-Square Tests Value df Asymptotic Significance (2-sided) < 0.002 59.809a 1 Symmetric Measures 0.002 Value Approximate Significance 525 <.002 325 .002 488 A local supermarket in Tingley introduced a loyalty card app in January 2022. Customers buy groceries using the loyalty card app on their mobile phones. As a consultant to the local supermarket, you have been asked to conduct a study to examine the frequency of repeat purchases by customers. Specifically, you have been asked to assess whether there is a disparity in repeat purchases between consumers who use the loyalty card app and those who are not The following research questions were set. 1. Is the proportion of consumers who use the loyalty card app greater than 50%? 2. Is the proportion of consumers who make repeat purchases different between those who use the loyalty app and those who do not? The following two sets of hypotheses were stated. Null: Alternative: Null: Alternative: The proportion of consumers who use the loyalty app is equal to 50%. The proportion of consumers who use the loyalty app is greater than 50%. The proportion of consumers who make repeat purchases is not different between those who use the loyalty app and those who do not. The proportion of consumers who make repeat purchases is different between those who those who use the loyalty app and those who do not. A simple random survey was conducted among traditional supermarket shoppers. Two of the questions, taken from the research instrument, are reproduced below. Question 1: Do you make repeat purchases? Question 2: Do you use the loyalty app? 0. No 0. No 1. Yes 1. Yes Appendix - SPSS Output for Part 2 Required for Part 2 (comments for Part 2 should not exceed 400 words in total) To complete the following, you need to refer to the output in the Appendix below. The SPSS tables should be inserted into your report and used as statistical evidence. Use either a snipping tool to copy the tables in the appendix or copy the tables (saved as PNG images) from the file: 'SPSS Evidence' in the coursework folder. The tables are made available but a data set is NOT made available for Part 2. Tables can be found in the Appendix. Interpret Table 2.1 and prepare a short comment on your findings. Table 2.2 shows the output for a hypothesis test conducted to inform on research question 1 above. Interpret the output and prepare a short statistical report, in the classical style, to summarise your findings. In your report, you need to state the null and alternative hypotheses, name the hypothesis test conducted and fully explain the output (all relevant values), calculate and interpret the effect size, where relevant, and discuss the assumptions of the test. a. b. C. Based on your statistical interpretation, write a second comment aimed at the client to explain the outcome of the research in plain English. Table 2.3 shows the output for a hypothesis test conducted to inform on research question 2 above. Interpret the output and prepare a short statistical report, in the classical style, to summarise your findings. In your report, you need to state the null and alternative hypotheses, name the hypothesis test conducted and fully explain the output (all relevant values), calculate and interpret the effect size, where relevant, and discuss the assumptions. Based on your statistical interpretation, write a second comment aimed at the client to explain the outcome of the research in plain English. NB: Up to 10% of the marks is awarded for coursework management. Marks are awarded for professional presentation, use of section and paragraph titles and starting each task on a new page, among others. Appendix - SPSS Output for Part 2 Table 2.1 Valid Table 2.2 No Yes Total Table 2.3 The proportion No using Loyalty App Yes Total The Proportion using the Loyalty App Frequency Percent Category Nominal by Nominal N of Valid Cases Phi 300 188 488 Binomial Test N Cramer's V 300 188 488 61.0 39.0 100.0 Observed Prop. 0.79 0.21 1.00 Valid Percent Test Prop. 0.50 Pearson Chi-Square N of Valid Cases 488 a. 0 cells (0%) have expected count less than 5. The minimum expected count is 7.94. 61.0 39.0 100.0 Exact Sig. (2- tailed) Chi-Square Tests Value df Asymptotic Significance (2-sided) < 0.002 59.809a 1 Symmetric Measures 0.002 Value Approximate Significance 525 <.002 325 .002 488 A local supermarket in Tingley introduced a loyalty card app in January 2022. Customers buy groceries using the loyalty card app on their mobile phones. As a consultant to the local supermarket, you have been asked to conduct a study to examine the frequency of repeat purchases by customers. Specifically, you have been asked to assess whether there is a disparity in repeat purchases between consumers who use the loyalty card app and those who are not The following research questions were set. 1. Is the proportion of consumers who use the loyalty card app greater than 50%? 2. Is the proportion of consumers who make repeat purchases different between those who use the loyalty app and those who do not? The following two sets of hypotheses were stated. Null: Alternative: Null: Alternative: The proportion of consumers who use the loyalty app is equal to 50%. The proportion of consumers who use the loyalty app is greater than 50%. The proportion of consumers who make repeat purchases is not different between those who use the loyalty app and those who do not. The proportion of consumers who make repeat purchases is different between those who those who use the loyalty app and those who do not. A simple random survey was conducted among traditional supermarket shoppers. Two of the questions, taken from the research instrument, are reproduced below. Question 1: Do you make repeat purchases? Question 2: Do you use the loyalty app? 0. No 0. No 1. Yes 1. Yes Appendix - SPSS Output for Part 2 Required for Part 2 (comments for Part 2 should not exceed 400 words in total) To complete the following, you need to refer to the output in the Appendix below. The SPSS tables should be inserted into your report and used as statistical evidence. Use either a snipping tool to copy the tables in the appendix or copy the tables (saved as PNG images) from the file: 'SPSS Evidence' in the coursework folder. The tables are made available but a data set is NOT made available for Part 2. Tables can be found in the Appendix. Interpret Table 2.1 and prepare a short comment on your findings. Table 2.2 shows the output for a hypothesis test conducted to inform on research question 1 above. Interpret the output and prepare a short statistical report, in the classical style, to summarise your findings. In your report, you need to state the null and alternative hypotheses, name the hypothesis test conducted and fully explain the output (all relevant values), calculate and interpret the effect size, where relevant, and discuss the assumptions of the test. a. b. C. Based on your statistical interpretation, write a second comment aimed at the client to explain the outcome of the research in plain English. Table 2.3 shows the output for a hypothesis test conducted to inform on research question 2 above. Interpret the output and prepare a short statistical report, in the classical style, to summarise your findings. In your report, you need to state the null and alternative hypotheses, name the hypothesis test conducted and fully explain the output (all relevant values), calculate and interpret the effect size, where relevant, and discuss the assumptions. Based on your statistical interpretation, write a second comment aimed at the client to explain the outcome of the research in plain English. NB: Up to 10% of the marks is awarded for coursework management. Marks are awarded for professional presentation, use of section and paragraph titles and starting each task on a new page, among others. Appendix - SPSS Output for Part 2 Table 2.1 Valid Table 2.2 No Yes Total Table 2.3 The proportion No using Loyalty App Yes Total The Proportion using the Loyalty App Frequency Percent Category Nominal by Nominal N of Valid Cases Phi 300 188 488 Binomial Test N Cramer's V 300 188 488 61.0 39.0 100.0 Observed Prop. 0.79 0.21 1.00 Valid Percent Test Prop. 0.50 Pearson Chi-Square N of Valid Cases 488 a. 0 cells (0%) have expected count less than 5. The minimum expected count is 7.94. 61.0 39.0 100.0 Exact Sig. (2- tailed) Chi-Square Tests Value df Asymptotic Significance (2-sided) < 0.002 59.809a 1 Symmetric Measures 0.002 Value Approximate Significance 525 <.002 325 .002 488 A local supermarket in Tingley introduced a loyalty card app in January 2022. Customers buy groceries using the loyalty card app on their mobile phones. As a consultant to the local supermarket, you have been asked to conduct a study to examine the frequency of repeat purchases by customers. Specifically, you have been asked to assess whether there is a disparity in repeat purchases between consumers who use the loyalty card app and those who are not The following research questions were set. 1. Is the proportion of consumers who use the loyalty card app greater than 50%? 2. Is the proportion of consumers who make repeat purchases different between those who use the loyalty app and those who do not? The following two sets of hypotheses were stated. Null: Alternative: Null: Alternative: The proportion of consumers who use the loyalty app is equal to 50%. The proportion of consumers who use the loyalty app is greater than 50%. The proportion of consumers who make repeat purchases is not different between those who use the loyalty app and those who do not. The proportion of consumers who make repeat purchases is different between those who those who use the loyalty app and those who do not. A simple random survey was conducted among traditional supermarket shoppers. Two of the questions, taken from the research instrument, are reproduced below. Question 1: Do you make repeat purchases? Question 2: Do you use the loyalty app? 0. No 0. No 1. Yes 1. Yes Appendix - SPSS Output for Part 2 Required for Part 2 (comments for Part 2 should not exceed 400 words in total) To complete the following, you need to refer to the output in the Appendix below. The SPSS tables should be inserted into your report and used as statistical evidence. Use either a snipping tool to copy the tables in the appendix or copy the tables (saved as PNG images) from the file: 'SPSS Evidence' in the coursework folder. The tables are made available but a data set is NOT made available for Part 2. Tables can be found in the Appendix. Interpret Table 2.1 and prepare a short comment on your findings. Table 2.2 shows the output for a hypothesis test conducted to inform on research question 1 above. Interpret the output and prepare a short statistical report, in the classical style, to summarise your findings. In your report, you need to state the null and alternative hypotheses, name the hypothesis test conducted and fully explain the output (all relevant values), calculate and interpret the effect size, where relevant, and discuss the assumptions of the test. a. b. C. Based on your statistical interpretation, write a second comment aimed at the client to explain the outcome of the research in plain English. Table 2.3 shows the output for a hypothesis test conducted to inform on research question 2 above. Interpret the output and prepare a short statistical report, in the classical style, to summarise your findings. In your report, you need to state the null and alternative hypotheses, name the hypothesis test conducted and fully explain the output (all relevant values), calculate and interpret the effect size, where relevant, and discuss the assumptions. Based on your statistical interpretation, write a second comment aimed at the client to explain the outcome of the research in plain English. NB: Up to 10% of the marks is awarded for coursework management. Marks are awarded for professional presentation, use of section and paragraph titles and starting each task on a new page, among others. Appendix - SPSS Output for Part 2 Table 2.1 Valid Table 2.2 No Yes Total Table 2.3 The proportion No using Loyalty App Yes Total The Proportion using the Loyalty App Frequency Percent Category Nominal by Nominal N of Valid Cases Phi 300 188 488 Binomial Test N Cramer's V 300 188 488 61.0 39.0 100.0 Observed Prop. 0.79 0.21 1.00 Valid Percent Test Prop. 0.50 Pearson Chi-Square N of Valid Cases 488 a. 0 cells (0%) have expected count less than 5. The minimum expected count is 7.94. 61.0 39.0 100.0 Exact Sig. (2- tailed) Chi-Square Tests Value df Asymptotic Significance (2-sided) < 0.002 59.809a 1 Symmetric Measures 0.002 Value Approximate Significance 525 <.002 325 .002 488
Expert Answer:
Answer rating: 100% (QA)
a According to the information provided in Table 21 65 percent of the consumers who were questioned stated that they had downloaded and used the loyal... View the full answer

Related Book For 

Principles of Information Systems
ISBN: 978-1305971776
13th edition
Authors: Ralph Stair, George Reynolds
Posted Date:
Students also viewed these general management questions
-
Case Study: Quick Fix Dental Practice Technology requirements Application must be built using Visual Studio 2019 or Visual Studio 2017, professional or enterprise. The community edition is not...
-
Planning is one of the most important management functions in any business. A front office managers first step in planning should involve determine the departments goals. Planning also includes...
-
Googles ease of use and superior search results have propelled the search engine to its num- ber one status, ousting the early dominance of competitors such as WebCrawler and Infos- eek. Even later...
-
Consider the Boolean function given below where X1, X2, X3, X4 and X5 are the attributes and Y is the class variable. Your task is to implement the neural network architecture and implement it for...
-
When are sales and cost variances favorable and unfavorable?
-
Solve the systems in Problems \(27-38\) by the addition method. \(\left\{\begin{array}{l}x+y=16 \\ x-y=10\end{array}ight.\)
-
Refer to the information in QS 13-4. Use that information for Tide Corporation to determine the 2016 and 2017 common-size percents for cost of goods sold using net sales as the base. Data From QS...
-
Metro Shuttle Company is considering investing in two new vans that are expected to generate combined cash inflows of $28,000 per year. The vans combined purchase price is $91,000. The expected life...
-
Scenario 17:Accountant 17 is the former manager of the audit dept. She says: when covid hit I decidedto retire. I was a cpa for 30 years but im no longer practicing, can I still call myself a cpa? Do...
-
Gordon Temper is a single taxpayer (birthdate July 1, 1985, and Social Security number 242-11-6767) who operates a food truck that specializes in food from South Africa. His business is named "Mobile...
-
1. Portfolio return. At the beginning of 2018, you invested $20,000 in Magee's Wonder Corporation (MWC), trading at $20 per share. MWC earned a return of 14% in 2018, 20% in 2019, -8% in 2020. Assume...
-
A square loop with sides 1 2 cm by 1 2 cm has 2 5 turns of wire and is in a magnetic field of strength 4 . 2 x 1 0 ^ - 2 T with its axis perpendicular to the direction of the field. if it is rotated...
-
How do post-transcriptional and post-translational regulatory mechanisms, such as microRNA-mediated gene silencing and protein modification, contribute to the fine-tuning of developmental processes,...
-
Grandin Inc. is evaluating its dividend policy. It has a capital budget of $625,000, and it wants to maintain a target capital structure of 60% debt and 40% equity. The company forecasts a net income...
-
recording a lon term lease as an operating lease as opposed to a capital lease what will cause for a lease are the debt to equity will be higher than total asset turnover? Explain.
-
Consider a reaction that has a negative AH and a positive AS. Which of the following statements is true? This reaction will be nonspontaneous only at high temperatures. This reaction will be...
-
(a) (1 point) Suppose F and G are two linear maps from R to R with FH=CH, FQ=GN- What is the relation of the two linear maps F and G. (b) (1 point) Look at R with coordinate axes labelled by z, y, z....
-
Chloroplasts are illuminated until the levels of the Calvin cycle intermediates reach a steady state. The light is then turned off. How does the level of RuBP vary after this point?
-
Plan, set up, and execute a meeting with another team wherein you meet via the use of a Web service such as GoToMeeting or WebEx. What are some of the problems you encountered in setting up and...
-
What new risks are raised by placing the new system of sensors on the Internet of Things?
-
With your team members, meet with several business managers at a firm that has implemented an enterprise system. Interview them to document the scope, cost, and schedule for the overall project. Find...
-
An investor is considering adding three new securities to her internationally focused, fixed-income portfolio. She considers the following non-callable securities: 1-year government bond 10-year...
-
Jo Akumbas portfolio is invested in a range of developed markets fixed-income securities. She asks her adviser about the possibility of diversifying her investments to include emerging and frontier...
-
An analyst is reviewing various asset alternatives and is presented with the following information relating to the broad equity market of Switzerland and various industries within the Swiss market...

Study smarter with the SolutionInn App