

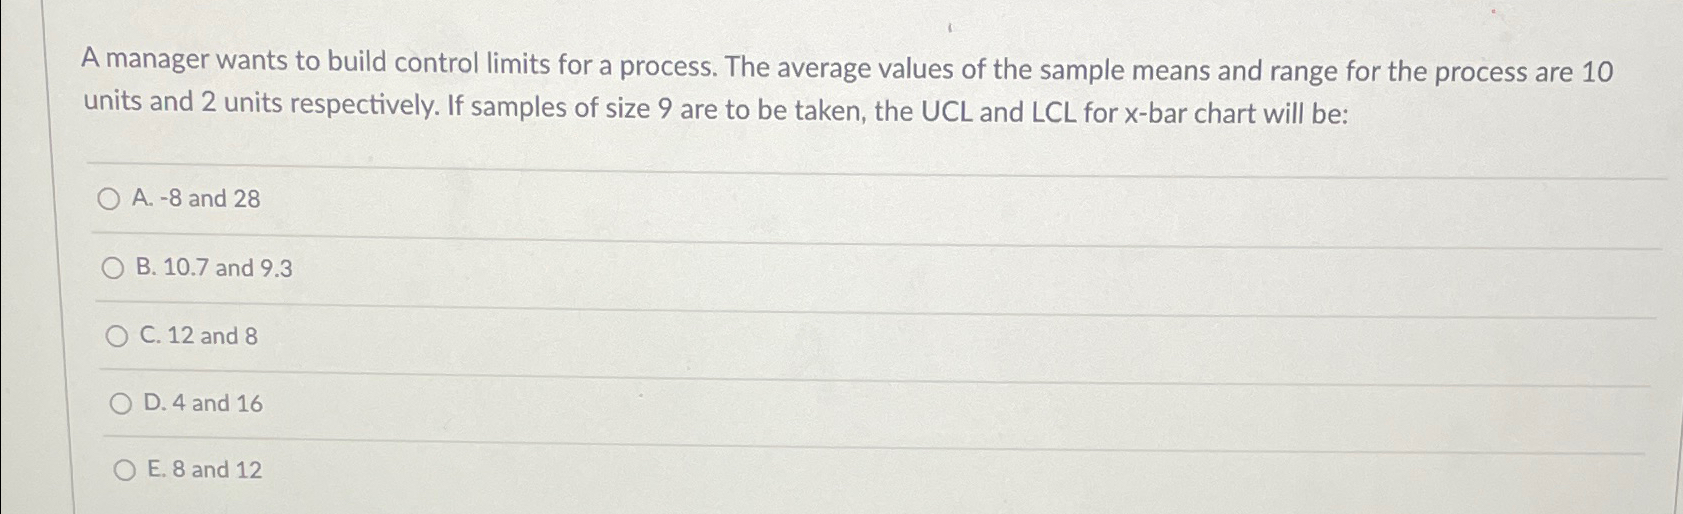
Question: A manager wants to build control limits for a process. The average values of the sample means and range for the process are 1 0
A manager wants to build control limits for a process. The average values of the sample means and range for the process are units and units respectively. If samples of size are to be taken, the UCL and LCL for bar chart will be:
A and
B and
C and
D and
E and
Step by Step Solution
There are 3 Steps involved in it
1 Expert Approved Answer
Step: 1 Unlock

Question Has Been Solved by an Expert!
Get step-by-step solutions from verified subject matter experts
Step: 2 Unlock
Step: 3 Unlock