

Question: A manager wishes to build a 3-sigma range chart for a process. The sample size is 7 , the mean of sample means is 26
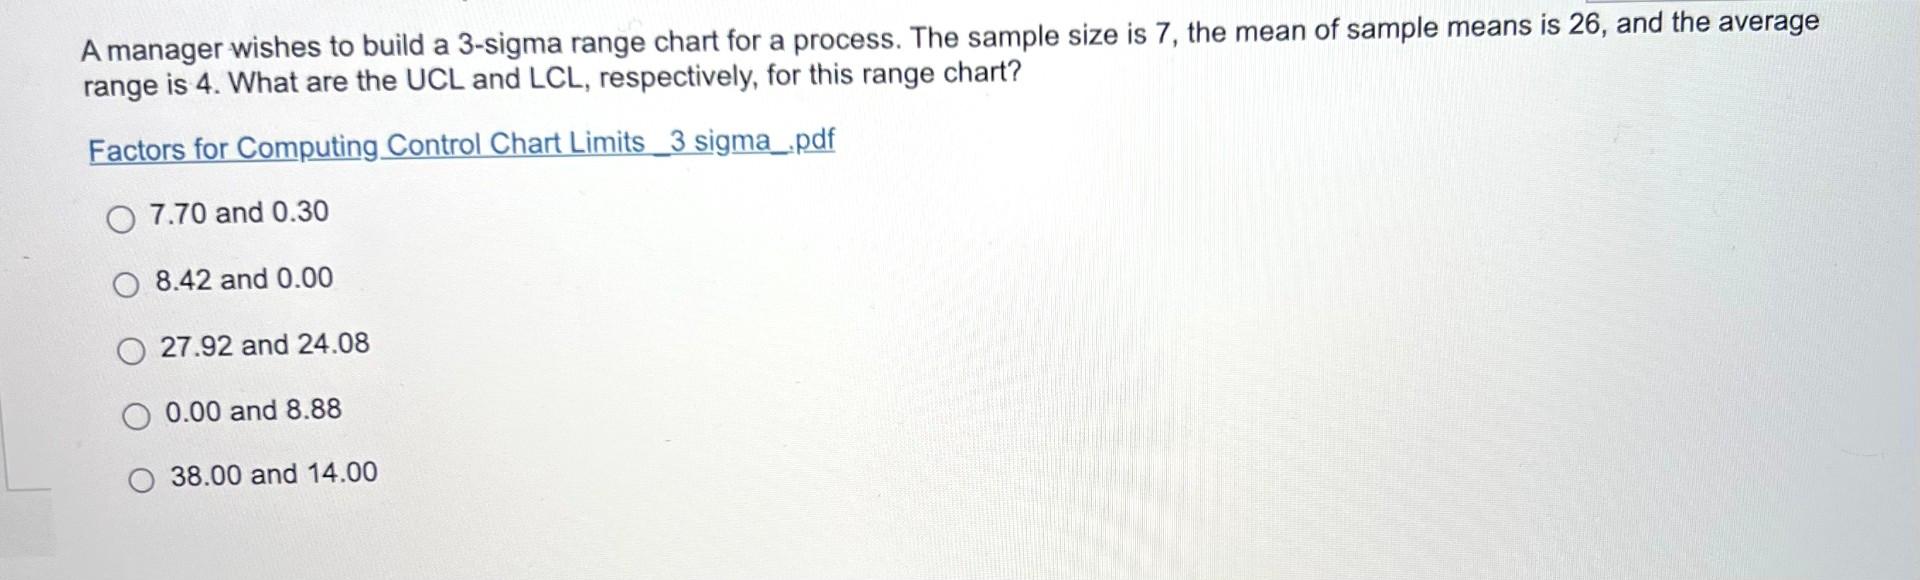
A manager wishes to build a 3-sigma range chart for a process. The sample size is 7 , the mean of sample means is 26 , and the average range is 4 . What are the UCL and LCL, respectively, for this range chart? Factors for Computing_Control Chart Limits 3 sigma_.pdf 7.70 and 0.30 8.42 and 0.00 27.92 and 24.08 0.00 and 8.88 38.00 and 14.00
Step by Step Solution
There are 3 Steps involved in it
1 Expert Approved Answer
Step: 1 Unlock

Question Has Been Solved by an Expert!
Get step-by-step solutions from verified subject matter experts
Step: 2 Unlock
Step: 3 Unlock