

Question: ( a ) Modify the function ex _ with 2 eqs to solve the IVP ( 4 ) for 0 t 6 0 using the
a Modify the function exwith eqs to solve the IVP for using the MATLAB
routine ode Call the new function LABex
Let note the upper case be the output of ode and and the unknown functions.
Use the following commands to define the ODE:
function
;;
;;
Plot and in the same window do not use subplot and the phase plot showing vs
in a separate window.
Add a legend to the first plot. Note: to display use
Add a grid. Use the command ylim to adjust the limits for both plots. Adjust
the limits in the phase plot so as to reproduce the pictures in Figure
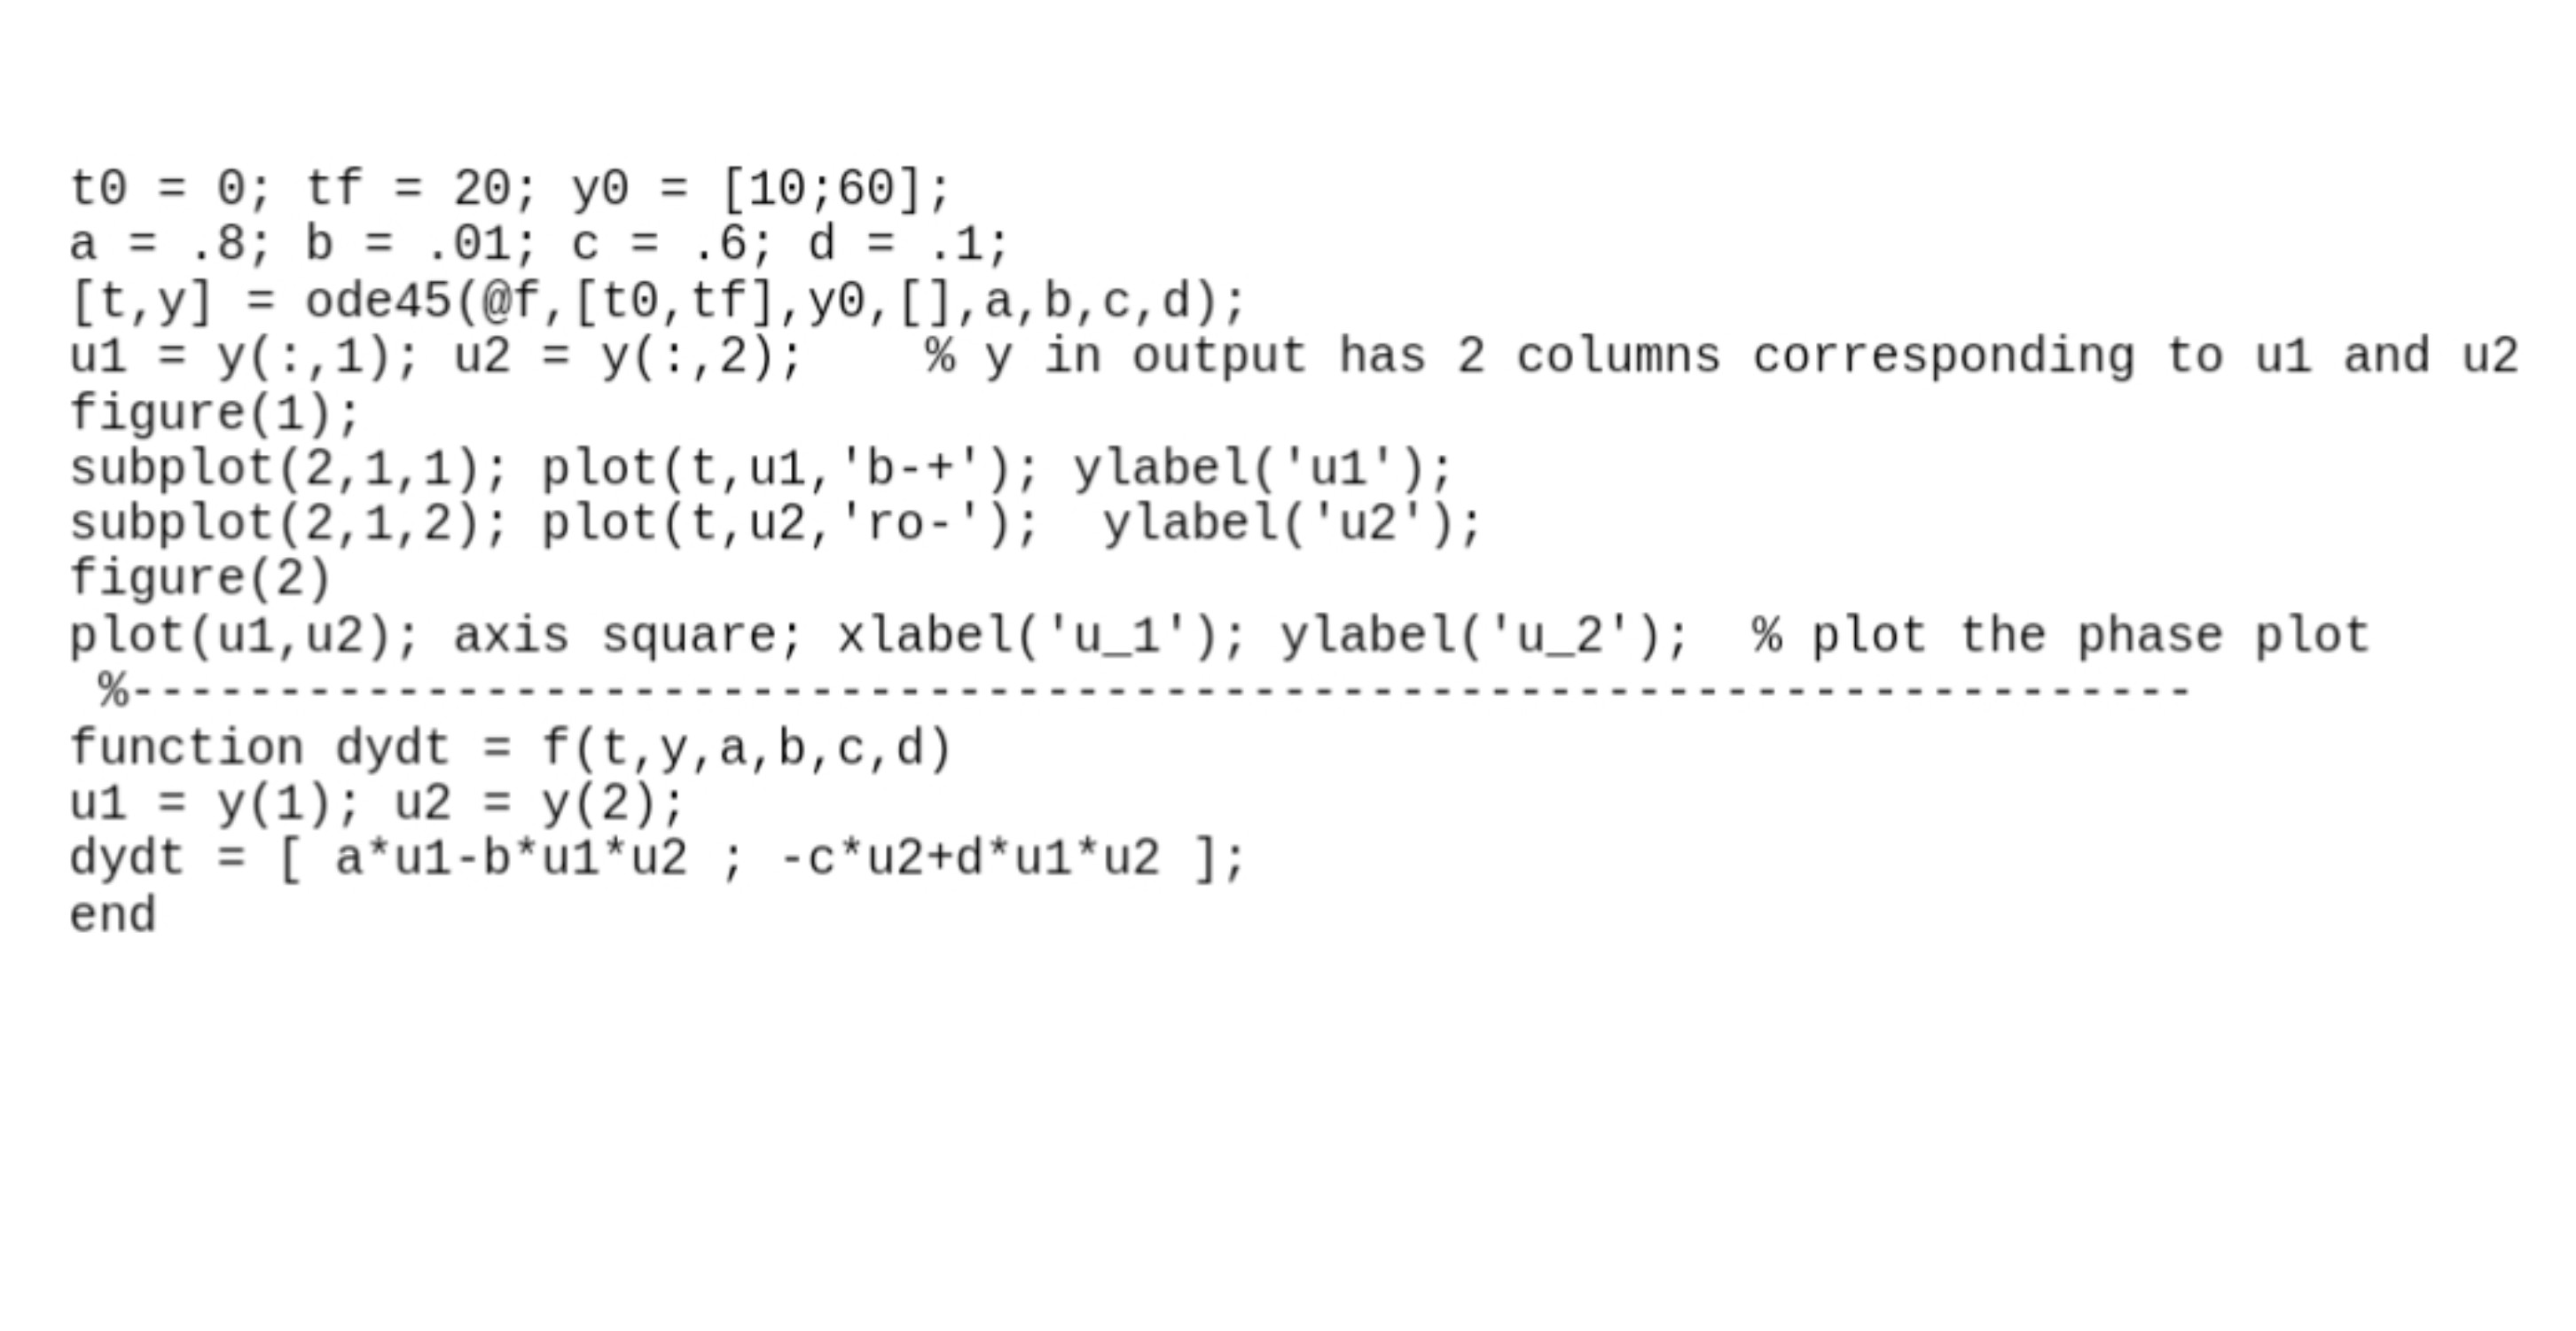
Figure : Time series and left and phase plot vs for ;;;;
;;;;
ode@;
:;:; y in output has columns corresponding to u and u
figure;
subplot; plottub; ylabelu;
subplot; plotturo; ylabelu;
figure
plotuu; axis square; xlabelu; ylabelu; plot the phase plot
function dydt
;;
dydt ;;
end
Step by Step Solution
There are 3 Steps involved in it
1 Expert Approved Answer
Step: 1 Unlock

Question Has Been Solved by an Expert!
Get step-by-step solutions from verified subject matter experts
Step: 2 Unlock
Step: 3 Unlock