

Question: a. months are shown below: b. MONTH Five months ago Four months ago Three months ago Two months ago One month ago The actual
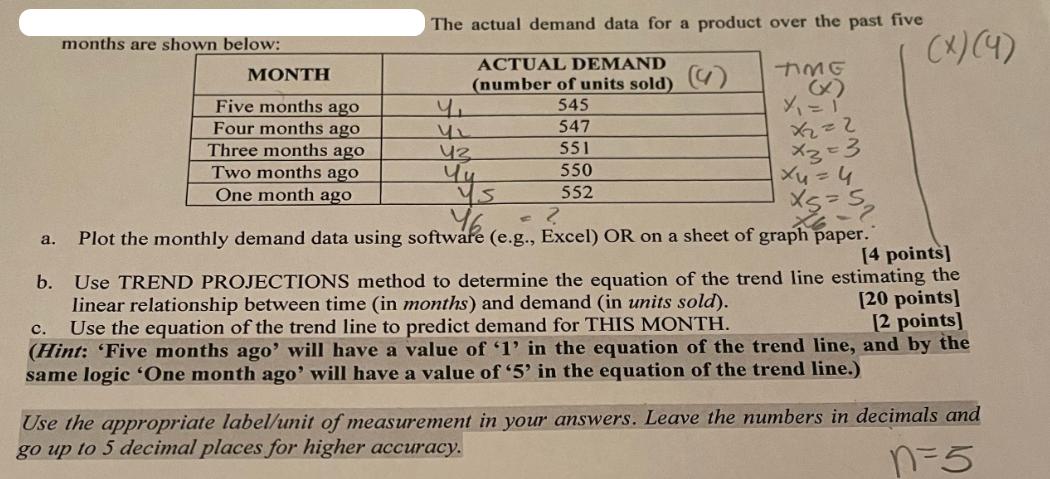
a. months are shown below: b. MONTH Five months ago Four months ago Three months ago Two months ago One month ago The actual demand data for a product over the past five ACTUAL DEMAND (number of units sold) () 545 4 42 Yu ys 547 551 550 552 TIMG (x) X = 1 x2=2 x3=3 x = 4 Plot the monthly demand data using softwafe (e.g., Excel) OR on a sheet of graph paper. ? X5=528 (X)(4) [4 points] Use TREND PROJECTIONS method to determine the equation of the trend line estimating the linear relationship between time (in months) and demand (in units sold). Use the equation of the trend line to predict demand for THIS MONTH. (Hint: 'Five months ago' will have a value of '1' in the equation of the trend line, and by the same logic 'One month ago' will have a value of '5' in the equation of the trend line.) [20 points] [2 points] c. Use the appropriate label/unit of measurement in your answers. Leave the numbers in decimals and go up to 5 decimal places for higher accuracy. n=5
Step by Step Solution
There are 3 Steps involved in it

Get step-by-step solutions from verified subject matter experts