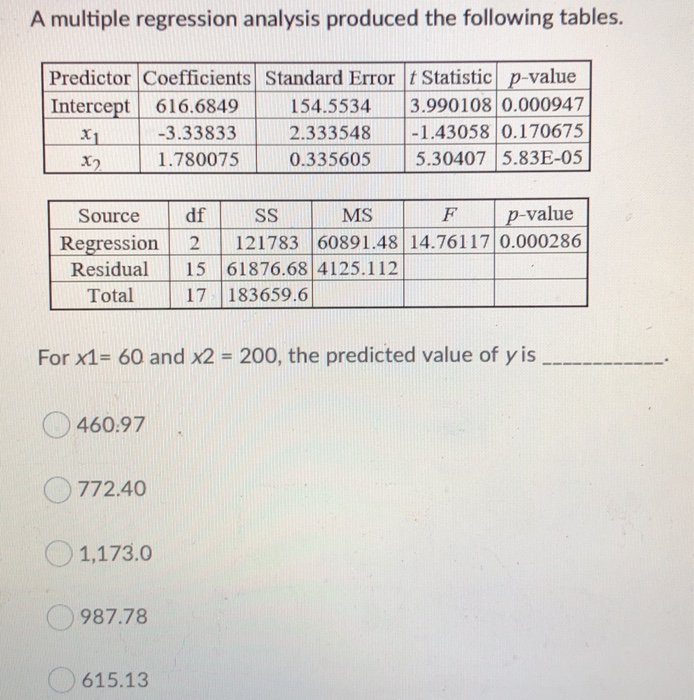
Question: A multiple regression analysis produced the following tables. Predictor Coefficients Standard Errort Statistic p-value Intercept 616.6849 154.5534 3.990108 0.000947 -3.33833 2.333548 -1.43058 0.170675 1.780075 0.335605

A multiple regression analysis produced the
A multiple regression analysis produced the following tables. Predictor Coefficients Standard Errort Statistic p-value Intercept 616.6849 154.5534 3.990108 0.000947 -3.33833 2.333548 -1.43058 0.170675 1.780075 0.335605 5.30407 5.83E-05 X1 Source Regression Residual Total df SS MS F p-value 2 121783 60891.48 14.76117 0.000286 15 61876.68 4125.112 17 183659.6 For x1= 60 and X2 = 200, the predicted value of yis 460.97 772.40 1,173.0 987.78 615.13

Step by Step Solution

There are 3 Steps involved in it

1 Expert Approved Answer
Step: 1 Unlock blur-text-image
Question Has Been Solved by an Expert!

Get step-by-step solutions from verified subject matter experts

Step: 2 Unlock
Step: 3 Unlock

Students Have Also Explored These Related General Management Questions!