

Question: A multiple regression analysis produced the following tables. Using = 0.05 to test the null hypothesis H 0 : 2 = 0, the correct decision
A multiple regression analysis produced the following tables.
Using = 0.05 to test the null hypothesis H0: 2 = 0, the correct decision is
| a)there is not enough information provided to make a decision |
| b)fail to reject the alternative hypothesis |
| c)fail to reject the null hypothesis |
| d)reject the alternative hypothesis |
| e)reject the null hypothesis |
Using = 0.05 to test the null hypothesis H0: 1 = 0, the correct decision is ____.
| a)fail to reject the null hypothesis |
| b)reject the null hypothesis |
| c) reject the alternative hypothesis |
| d) there is not enough information provided to make a decision |
| e) fail to reject the alternative hypothes |
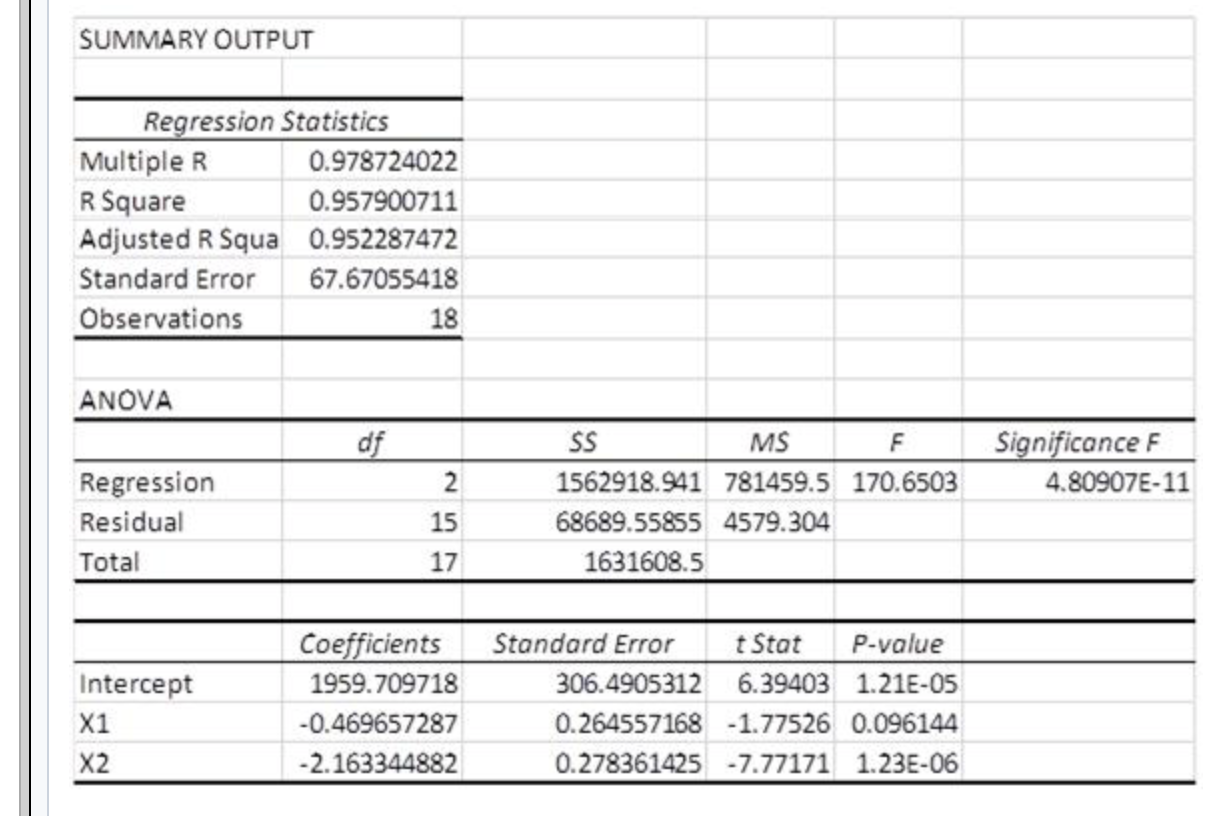
SUMMARY OUTPUT Regression Statistics Multiple R 0.978724022 R Square 0.957900711 Adjusted R Squa 0.952287472 Standard Error 67.67055418 Observations 18 ANOVA df Significance F 4.80907E-11 2 Regression Residual Total SS MS F 1562918.941 781459.5 170.6503 68689.55855 4579.304 1631608.5 15 17 Intercept X1 X2 Coefficients 1959.709718 -0.469657287 -2.163344882 Standard Error t Stat P-value 306.4905312 6.39403 1.21E-05 0.264557168 -1.77526 0.096144 0.278361425 -7.77171 1.23E-06
Step by Step Solution
There are 3 Steps involved in it

Get step-by-step solutions from verified subject matter experts