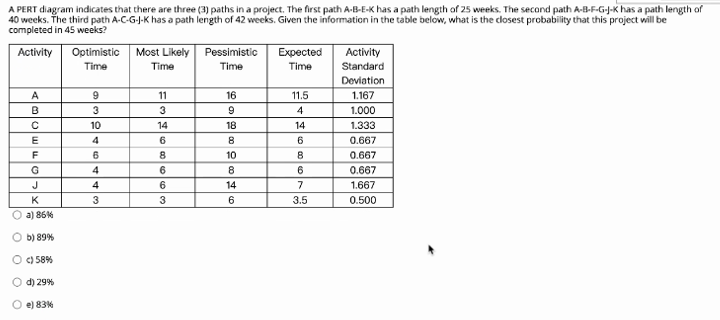
Question: A PERT diagram indicates that there are three (3) paths in a project. The first path A-B-E-K has a path length of 25 weeks. The

A PERT diagram indicates that there are three (3)

A PERT diagram indicates that there are three (3) paths in a project. The first path A-B-E-K has a path length of 25 weeks. The second path A-B-F-G-J-k has a path length of 40 weeks. The third path A-C-G-J-K has a path length of 42 weeks. Given the information in the table below, what is the dosest probability that this project will be completed in 45 weeks? Activity Optimistic Most Likely Pessimistic Expected Activity Time Time Time Time Standard Deviation A 9 11 16 11.5 1.167 B 3 3 9 4 1.000 10 14 18 1.333 E 6 8 6 0.667 F 6 8 10 0.667 G 4 6 8 6 0.667 J 6 14 7 1.667 K 3 3 6 3.5 0.500 O a) 86% 14 4 b) 89% O c58% d) 299 e) 83%

Step by Step Solution

There are 3 Steps involved in it

1 Expert Approved Answer
Step: 1 Unlock blur-text-image
Question Has Been Solved by an Expert!

Get step-by-step solutions from verified subject matter experts

Step: 2 Unlock
Step: 3 Unlock

Students Have Also Explored These Related General Management Questions!