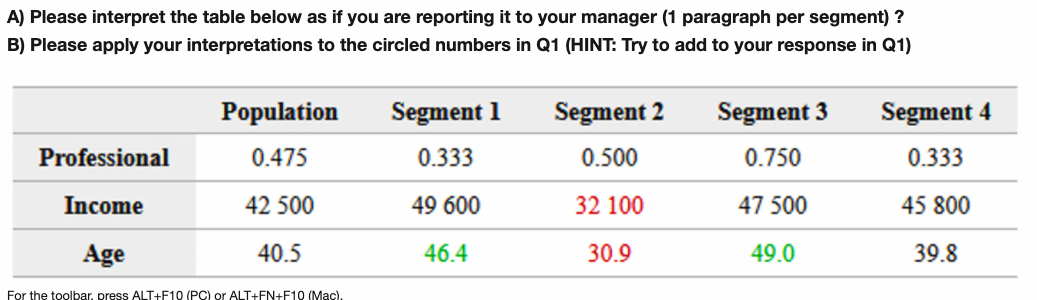
Question: A) Please interpret the table below as if you are reporting it to your manager (1 paragraph per segment) ? B) Please apply your interpretations

A) Please interpret the table below as if you are

A) Please interpret the table below as if you are reporting it to your manager (1 paragraph per segment) ? B) Please apply your interpretations to the circled numbers in Q1 (HINT: Try to add to your response in Q1) Population Segment 1 Segment 2 Segment 3 Segment 4 Professional 0.475 0.333 0.500 0.750 0.333 Income 42 500 49 600 32 100 47 500 45 800 Age 40.5 46.4 30.9 49.0 39.8 For the toolbar, press ALT+F10 (PC) or ALT+FN+F10 (Mac). A) Please interpret the table below as if you are reporting it to your manager (1 paragraph per segment) ? B) Please apply your interpretations to the circled numbers in Q1 (HINT: Try to add to your response in Q1) Population Segment 1 Segment 2 Segment 3 Segment 4 Professional 0.475 0.333 0.500 0.750 0.333 Income 42 500 49 600 32 100 47 500 45 800 Age 40.5 46.4 30.9 49.0 39.8 For the toolbar, press ALT+F10 (PC) or ALT+FN+F10 (Mac)

Step by Step Solution

There are 3 Steps involved in it

1 Expert Approved Answer
Step: 1 Unlock blur-text-image
Question Has Been Solved by an Expert!

Get step-by-step solutions from verified subject matter experts

Step: 2 Unlock
Step: 3 Unlock

Students Have Also Explored These Related General Management Questions!