

Question: (a) Plot accurately and neatly the Bode diagram for the process shown in Fig. P15-6, using log-log paper for gain versus frequency and semilog paper
(a) Plot accurately and neatly the Bode diagram for the process shown in Fig. P15-6, using log-log paper for gain versus frequency and semilog paper for phase versus frequency. Plot the frequency as radians per minute.
(b) Find the amplitude ratio and phase angle for Y/X at ? = 1 rad/min and ? = 4 rad/min. 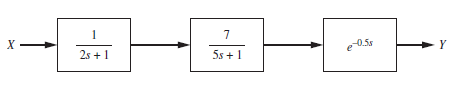
X 1 2s + 1 7 5s+1 e-0.5s Y
Step by Step Solution
★★★★★
3.40 Rating (147 Votes )
There are 3 Steps involved in it
1 Expert Approved Answer
Step: 1 Unlock

To solve this problem well go through the following steps Part a Plot the Bode Diagram 1 Identify th... View full answer
Question Has Been Solved by an Expert!
Get step-by-step solutions from verified subject matter experts
Step: 2 Unlock
Step: 3 Unlock