

Question: a. Plot the mass density distribution as a function of average particle size. b. What is the dominant crystal size? Crystal size distribution from screen
a. Plot the mass density distribution as a function of average particle size.
b. What is the dominant crystal size?
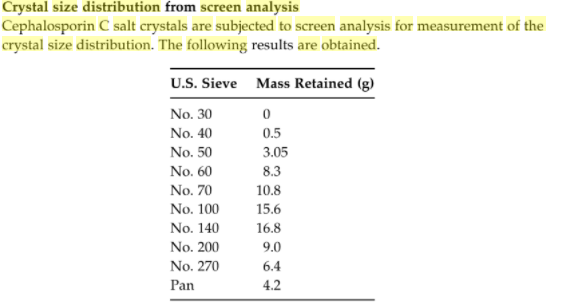
Crystal size distribution from screen analysis Cephalosporin C salt crystals are subjected to screen analysis for measurement of the crystal size distribution. The following results are obtained. U.S. Sieve Mass Retained (g) No. 30 0 No. 40 0.5 No. 50 3.05 No. 60 8.3 No. 70 10.8 No. 100 15.6 No. 140 16.8 No. 200 9.0 No. 270 Pan 4.2 6.4
Step by Step Solution
There are 3 Steps involved in it
1 Expert Approved Answer
Step: 1 Unlock

Question Has Been Solved by an Expert!
Get step-by-step solutions from verified subject matter experts
Step: 2 Unlock
Step: 3 Unlock