

Question: a. Plot the monthly data on a sheet of graph paper. b. Forecast September sales volume using each of the following: (1) The naive approach
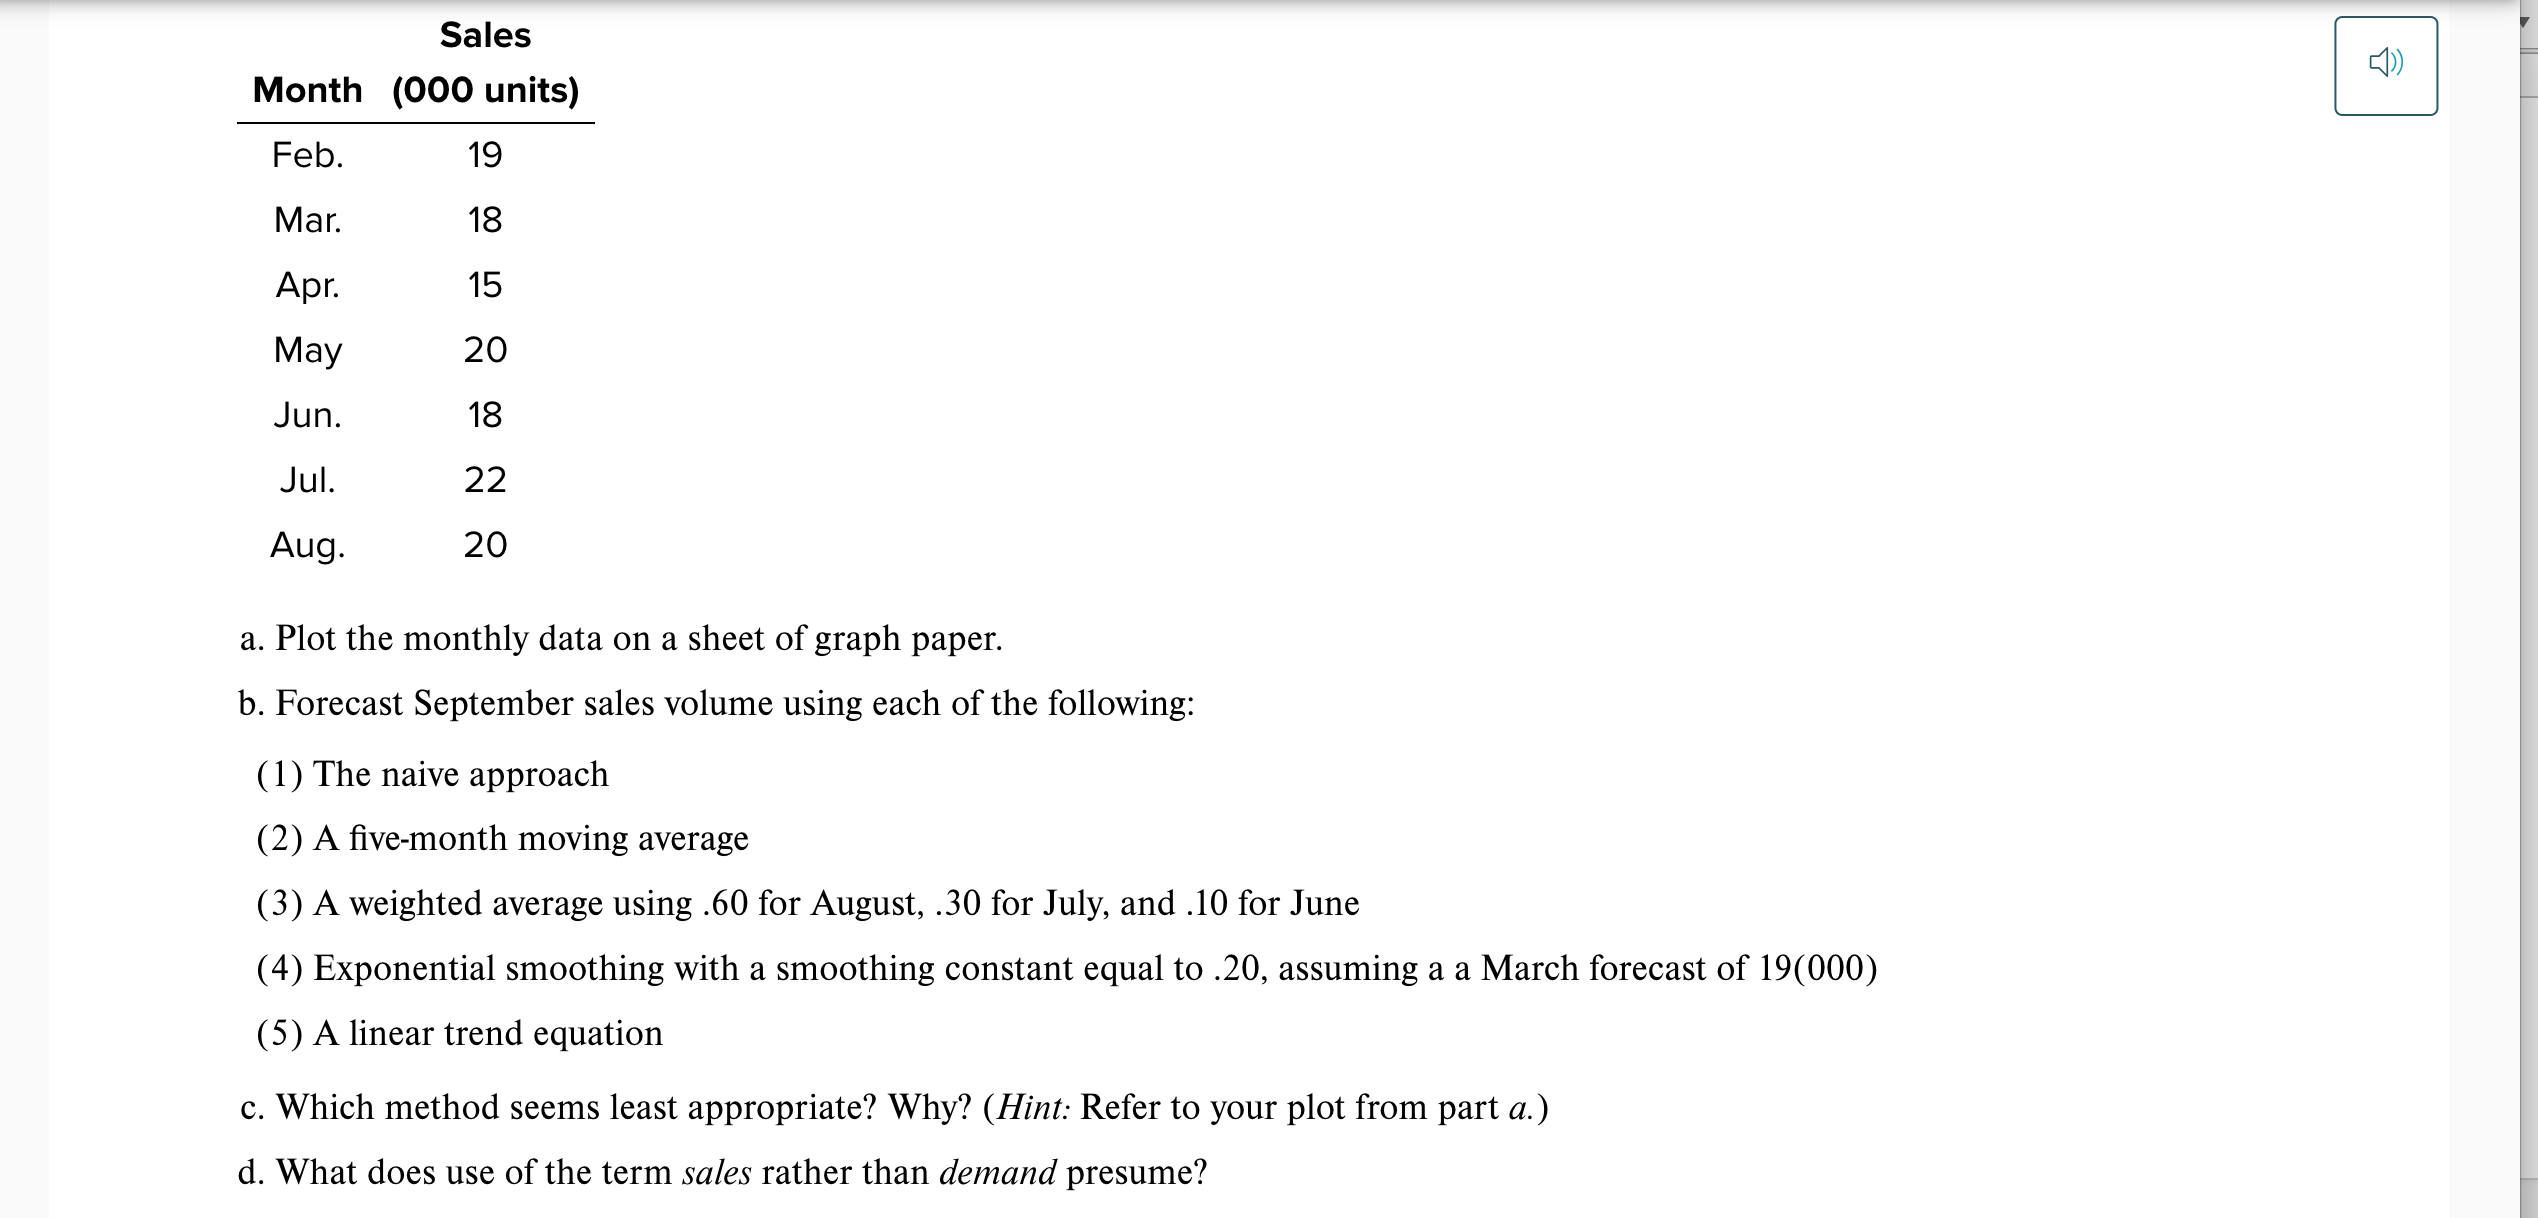
a. Plot the monthly data on a sheet of graph paper. b. Forecast September sales volume using each of the following: (1) The naive approach (2) A five-month moving average (3) A weighted average using .60 for August, .30 for July, and .10 for June (4) Exponential smoothing with a smoothing constant equal to .20, assuming a a March forecast of 19(000) (5) A linear trend equation c. Which method seems least appropriate? Why? (Hint: Refer to your plot from part a.) d. What does use of the term sales rather than demand presume? a. Plot the monthly data on a sheet of graph paper. b. Forecast September sales volume using each of the following: (1) The naive approach (2) A five-month moving average (3) A weighted average using .60 for August, .30 for July, and .10 for June (4) Exponential smoothing with a smoothing constant equal to .20, assuming a a March forecast of 19(000) (5) A linear trend equation c. Which method seems least appropriate? Why? (Hint: Refer to your plot from part a.) d. What does use of the term sales rather than demand presume
Step by Step Solution
There are 3 Steps involved in it

Get step-by-step solutions from verified subject matter experts