

Question: a. Plot the schematic rheological graph representing the evolution of the relaxation modulus G as a function of the time for a semi-crystalline polypropylene. b.
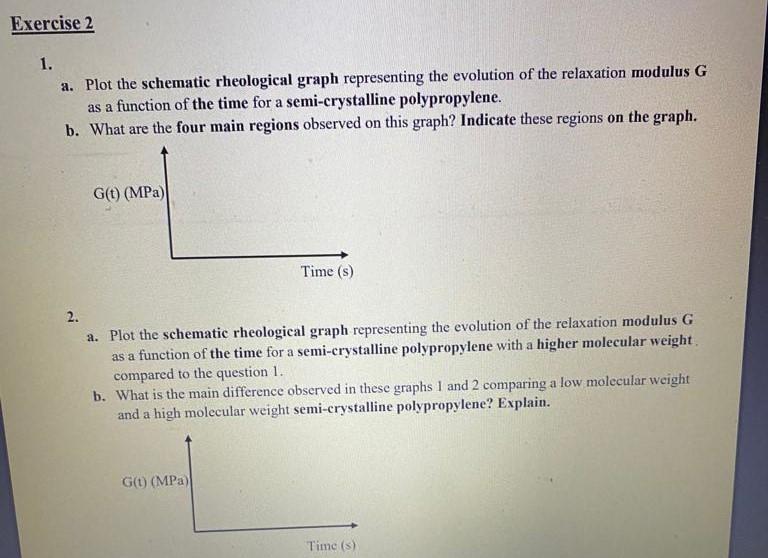
a. Plot the schematic rheological graph representing the evolution of the relaxation modulus G as a function of the time for a semi-crystalline polypropylene. b. What are the four main regions observed on this graph? Indicate these regions on the graph. 2. a. Plot the schematic rheological graph representing the evolution of the relaxation modulus G as a function of the time for a semi-crystalline polypropylene with a higher molecular weight compared to the question 1. b. What is the main difference observed in these graphs 1 and 2 comparing a low molecular weight and a high molecular weight semi-crystalline polypropylene? Explain
Step by Step Solution
There are 3 Steps involved in it
1 Expert Approved Answer
Step: 1 Unlock

Question Has Been Solved by an Expert!
Get step-by-step solutions from verified subject matter experts
Step: 2 Unlock
Step: 3 Unlock