

Question: Plot the schematic rheological graph representing the evolution of the relaxation modulus G as a function of the temperature for a semi-crystalline polypropylene. 4. Plot
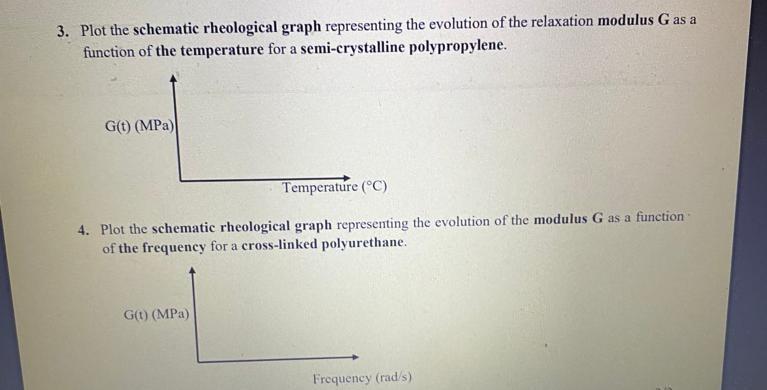
Plot the schematic rheological graph representing the evolution of the relaxation modulus G as a function of the temperature for a semi-crystalline polypropylene. 4. Plot the schematic rheological graph representing the evolution of the modulus G as a function of the frequency for a cross-linked polyurethane
Step by Step Solution
There are 3 Steps involved in it
1 Expert Approved Answer
Step: 1 Unlock

Question Has Been Solved by an Expert!
Get step-by-step solutions from verified subject matter experts
Step: 2 Unlock
Step: 3 Unlock