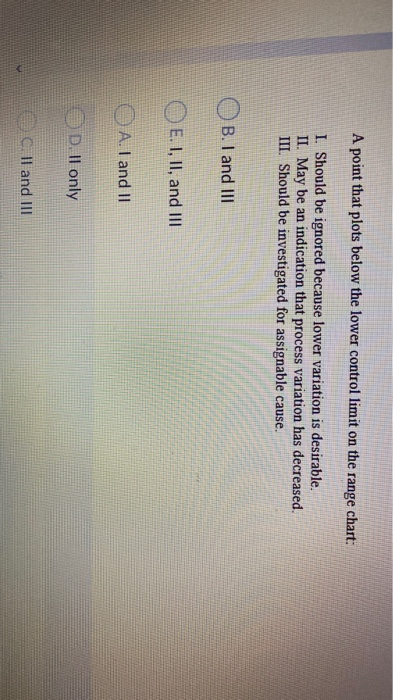
Question: A point that plots below the lower control limit on the range chart: I. Should be ignored because lower variation is desirable. II. May be

A point that plots below the lower control limit
A point that plots below the lower control limit on the range chart: I. Should be ignored because lower variation is desirable. II. May be an indication that process variation has decreased. III. Should be investigated for assignable cause. B. I and III E. I, II, and III A. I and II D. ll only C. II and

Step by Step Solution

There are 3 Steps involved in it

1 Expert Approved Answer
Step: 1 Unlock blur-text-image
Question Has Been Solved by an Expert!

Get step-by-step solutions from verified subject matter experts

Step: 2 Unlock
Step: 3 Unlock

Students Have Also Explored These Related General Management Questions!