

Question: A) Position-Time => Velocity-Time Conversions la. Consider the position time Position Time Graph graph shown at the right. Position 25 Calculate the velocity in 20
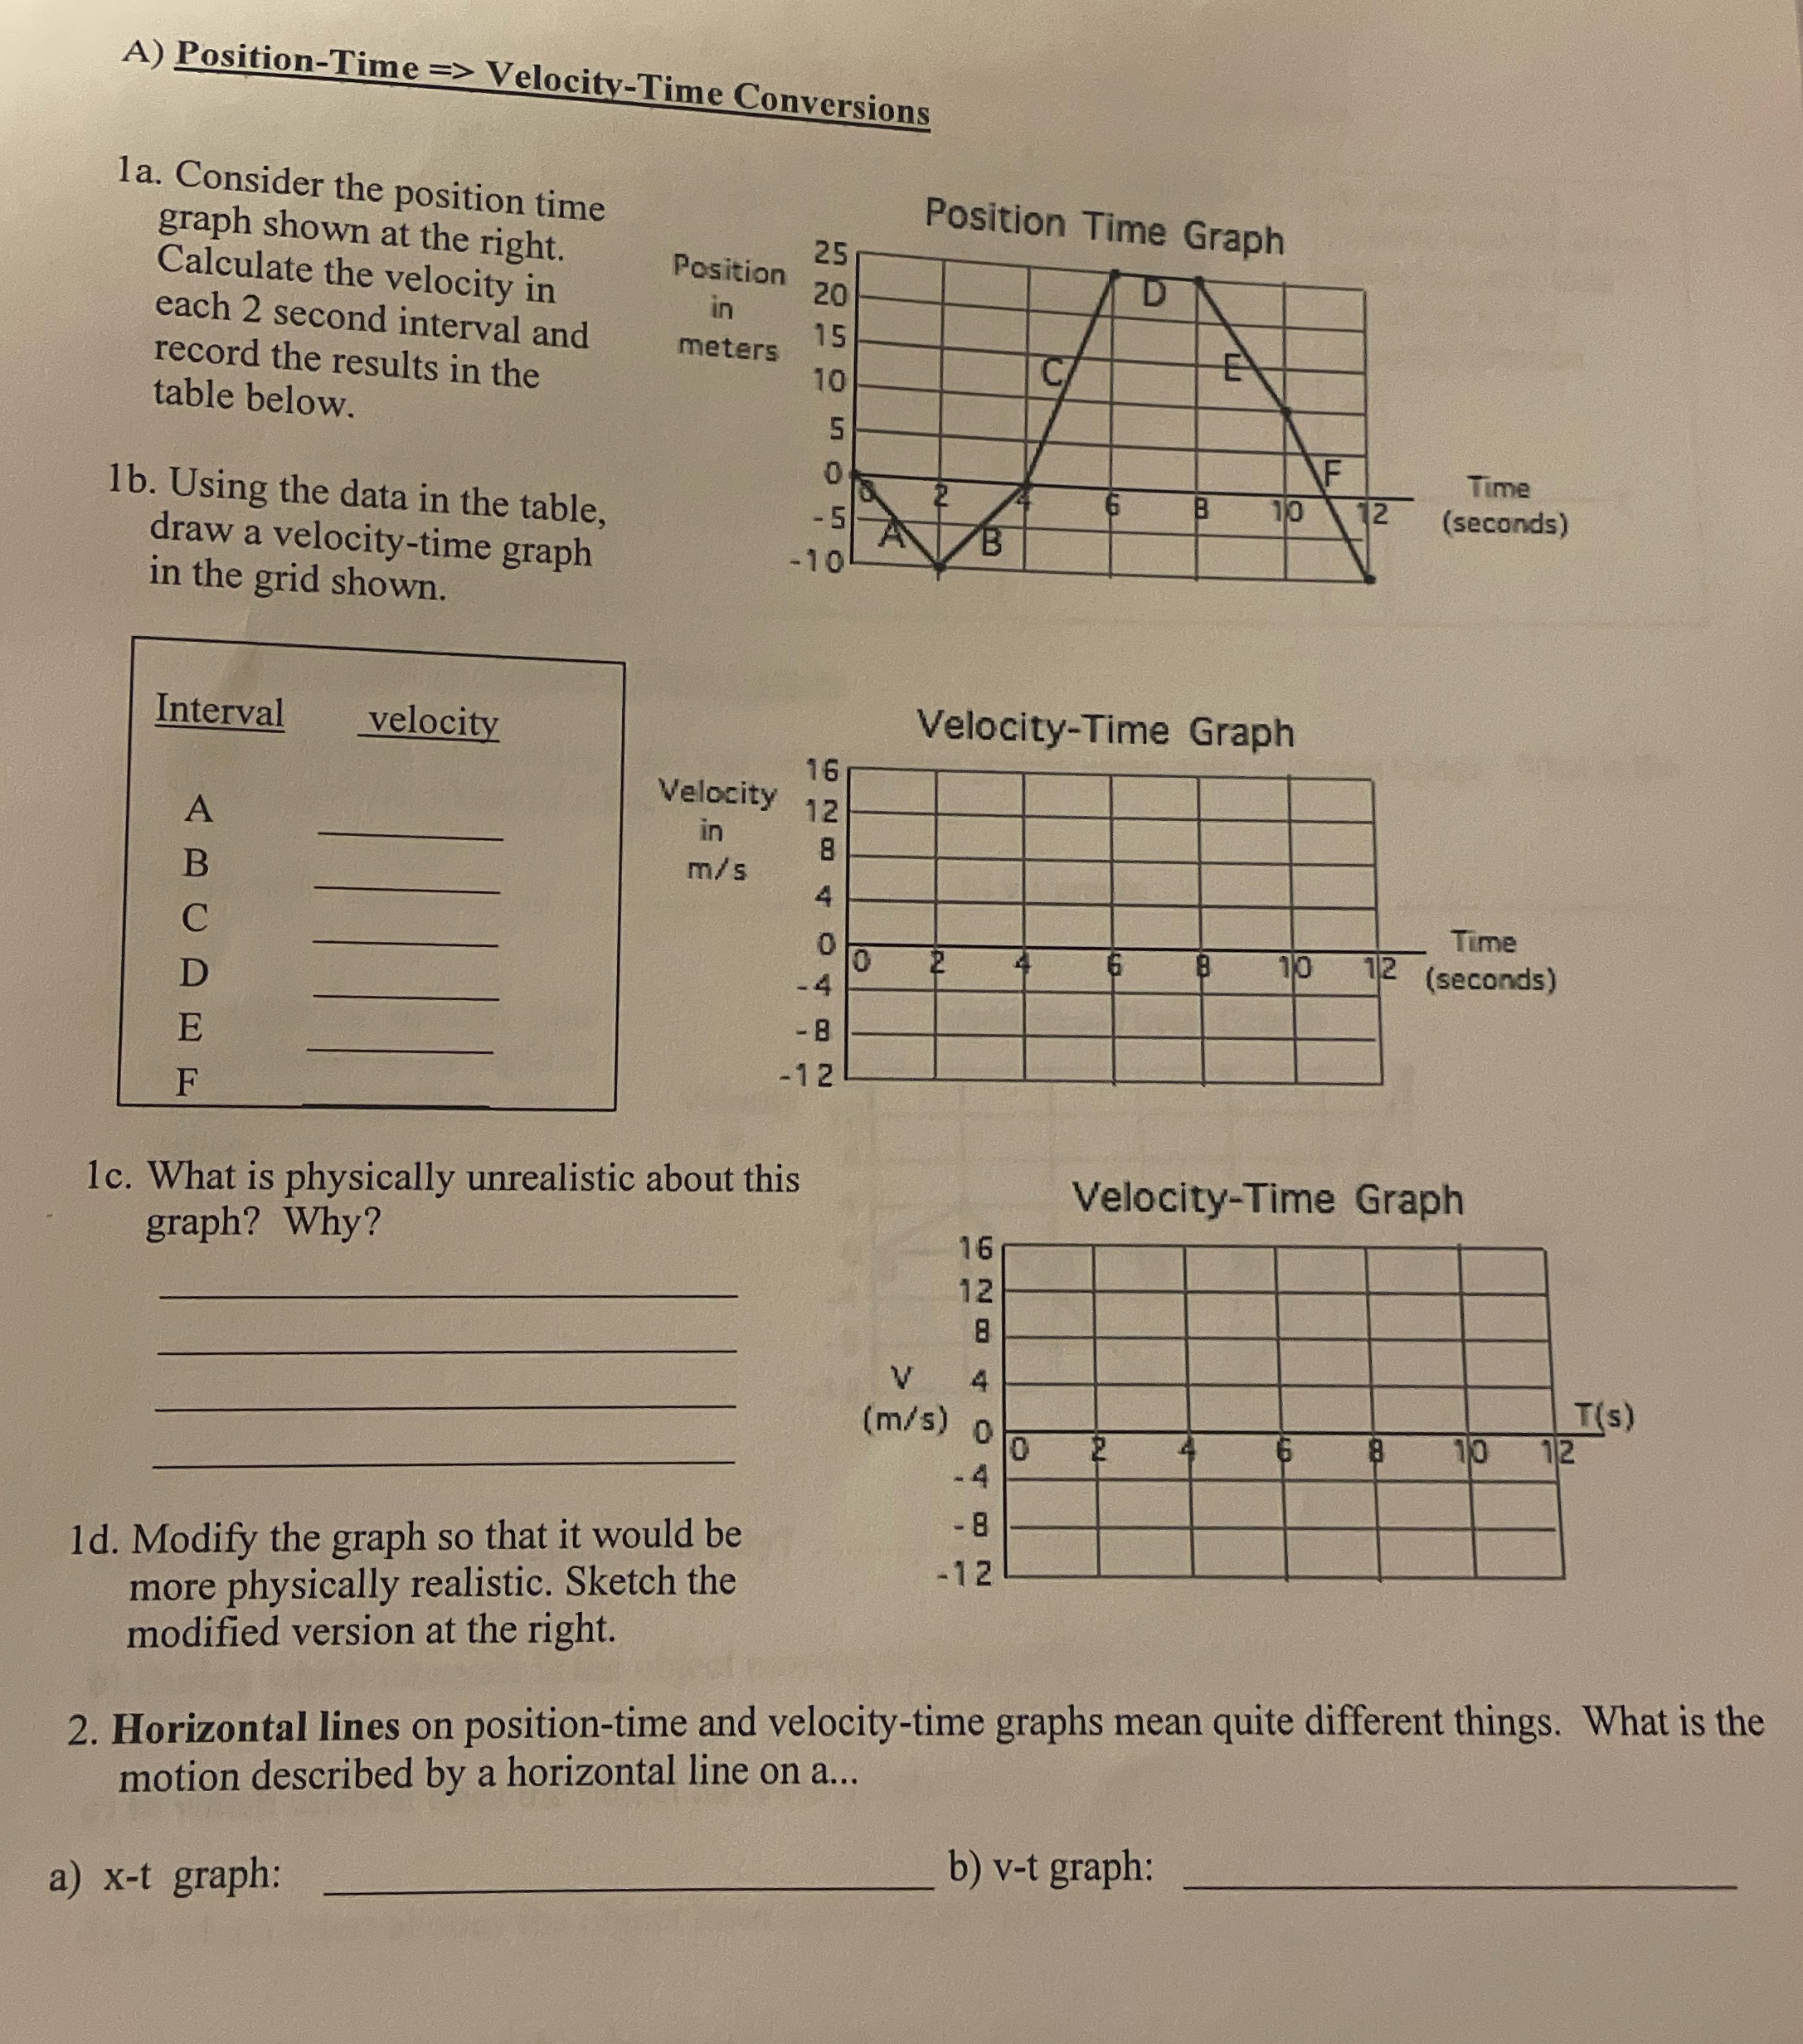
A) Position-Time => Velocity-Time Conversions la. Consider the position time Position Time Graph graph shown at the right. Position 25 Calculate the velocity in 20 in each 2 second interval and meters 15 record the results in the 10 c/ table below. Time 1b. Using the data in the table, 10 2 (seconds) draw a velocity-time graph -10 in the grid shown. Interval velocity Velocity-Time Graph Velocity 16 12 in m/ s Time 6 8 10 12 (seconds) - 4 - B 12 1c. What is physically unrealistic about this Velocity-Time Graph graph? Why? 16 12 8 V T (s ) (m/s) 0 10 12 - 4 - 8 1d. Modify the graph so that it would be - 12 more physically realistic. Sketch the modified version at the right. 2. Horizontal lines on position-time and velocity-time graphs mean quite different things. What is the motion described by a horizontal line on a... b) v-t graph: a) x-t graph
Step by Step Solution
There are 3 Steps involved in it

Get step-by-step solutions from verified subject matter experts