

Question: a) predict the value of y for x=2 b) predict the value of y for x=2.5c) predict the value of y for x=14d) predict the
a) predict the value of y for x=2 b) predict the value of y for x=2.5c) predict the value of y for x=14d) predict the value of y for x=3.5
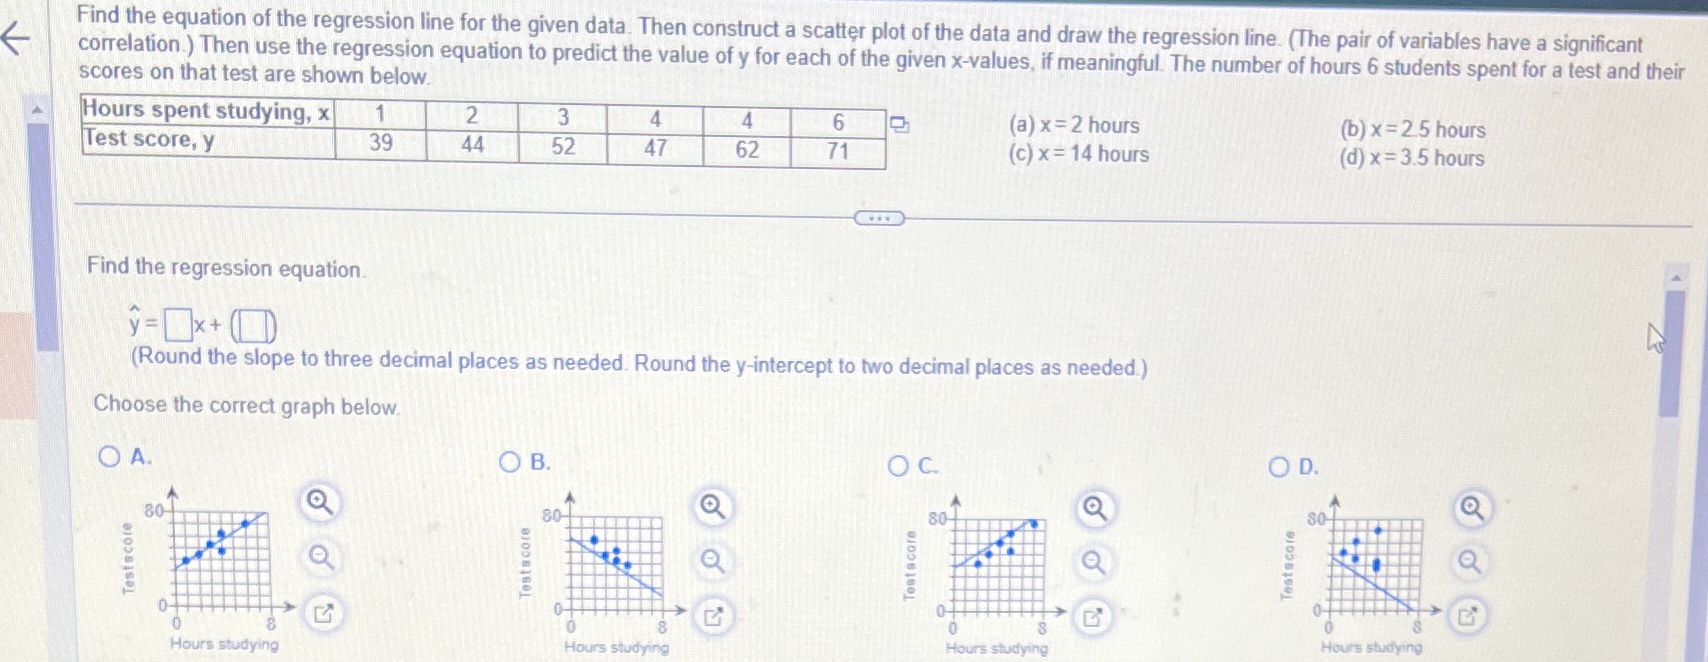
Find the equation of the regression line for the given data. Then construct a scatter plot of the data and draw the regression line. (The pair of variables have a significant correlation.) Then use the regression equation to predict the value of y for each of the given x-values, if meaningful. The number of hours 6 students spent for a test and their scores on that test are shown below. Hours spent studying, x 1 2 3 4 4 6 (a) x =2 hours (b) x =2.5 hours Test score, y 39 44 52 47 62 71 (c) x = 14 hours (d) x =3.5 hours Find the regression equation. " = x + 0) (Round the slope to three decimal places as needed. Round the y-intercept to two decimal places as needed.) Choose the correct graph below. OA. OB. O C. O D. O O 80 80- 80- O SO Testscare Testscore Test score Testscore S Hours studying Hours studying Hours studying Hours studying
Step by Step Solution
There are 3 Steps involved in it

Get step-by-step solutions from verified subject matter experts