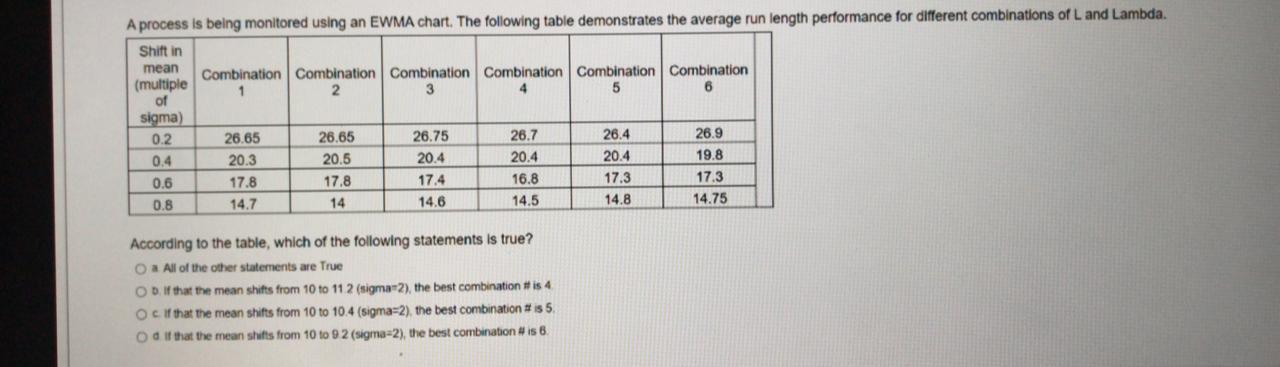
Question: A process is being monitored using an EWMA chart. The following table demonstrates the average run length performance for different combinations of Land Lambda. Shift

A process is being monitored using an EWMA chart.

A process is being monitored using an EWMA chart. The following table demonstrates the average run length performance for different combinations of Land Lambda. Shift in mean Combination Combination Combination Combination Combination Combination (multiple 1 2 3 4 5 6 of sigma) 0.2 26.65 26.65 26.75 26.7 26.4 26.9 0.4 20.5 20.4 20.4 20.4 19,8 0.6 17.8 17.8 17.4 16.8 17.3 17.3 0.8 14.7 14 14.6 14.5 14.8 14.75 20.3 According to the table, which of the following statements is true? O All of the other statements are True OD. If that the mean shifts from 10 to 11 2 (sigma-2), the best combination #fis 4 O cIf that the mean shifts from 10 to 10.4 (sigma-2), the best combination #is 5. Od if that the mean shifts from 10 to 9 2 (sigma-2), the best combination is 6

Step by Step Solution

There are 3 Steps involved in it

1 Expert Approved Answer
Step: 1 Unlock blur-text-image
Question Has Been Solved by an Expert!

Get step-by-step solutions from verified subject matter experts

Step: 2 Unlock
Step: 3 Unlock

Students Have Also Explored These Related General Management Questions!